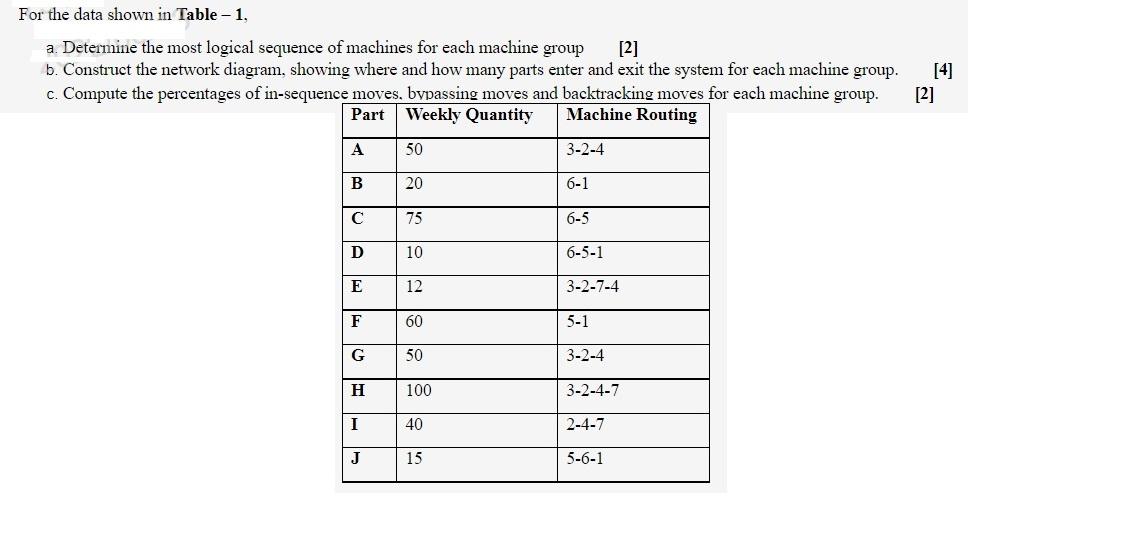
Question: For the data shown in Table - 1, a. Determine the most logical sequence of machines for each machine group [2] b. Construct the network

For the data shown in Table - 1, a. Determine the

For the data shown in Table - 1, a. Determine the most logical sequence of machines for each machine group [2] b. Construct the network diagram, showing where and how many parts enter and exit the system for each machine group. c. Compute the percentages of in-sequence moves, bypassing moves and backtracking moves for each machine group. Part Weekly Quantity Machine Routing [2] A 50 3-2-4 B 20 6-1 C 75 6-5 D 10 6-5-1 E 12 3-2-7-4 F 60 5-1 G 50 3-2-4 100 3-2-4-7 I 40 2-4-7 J 15 5-6-1 For the data shown in Table - 1, a. Determine the most logical sequence of machines for each machine group [2] b. Construct the network diagram, showing where and how many parts enter and exit the system for each machine group. c. Compute the percentages of in-sequence moves, bypassing moves and backtracking moves for each machine group. Part Weekly Quantity Machine Routing [2] A 50 3-2-4 B 20 6-1 C 75 6-5 D 10 6-5-1 E 12 3-2-7-4 F 60 5-1 G 50 3-2-4 100 3-2-4-7 I 40 2-4-7 J 15 5-6-1

Step by Step Solution

There are 3 Steps involved in it

1 Expert Approved Answer
Step: 1 Unlock blur-text-image
Question Has Been Solved by an Expert!

Get step-by-step solutions from verified subject matter experts

Step: 2 Unlock
Step: 3 Unlock

Students Have Also Explored These Related General Management Questions!