

Question: For the EEG wave patterns, the power spectral density plot calculated from the EEG data recorded at O z while a participant ( P 2
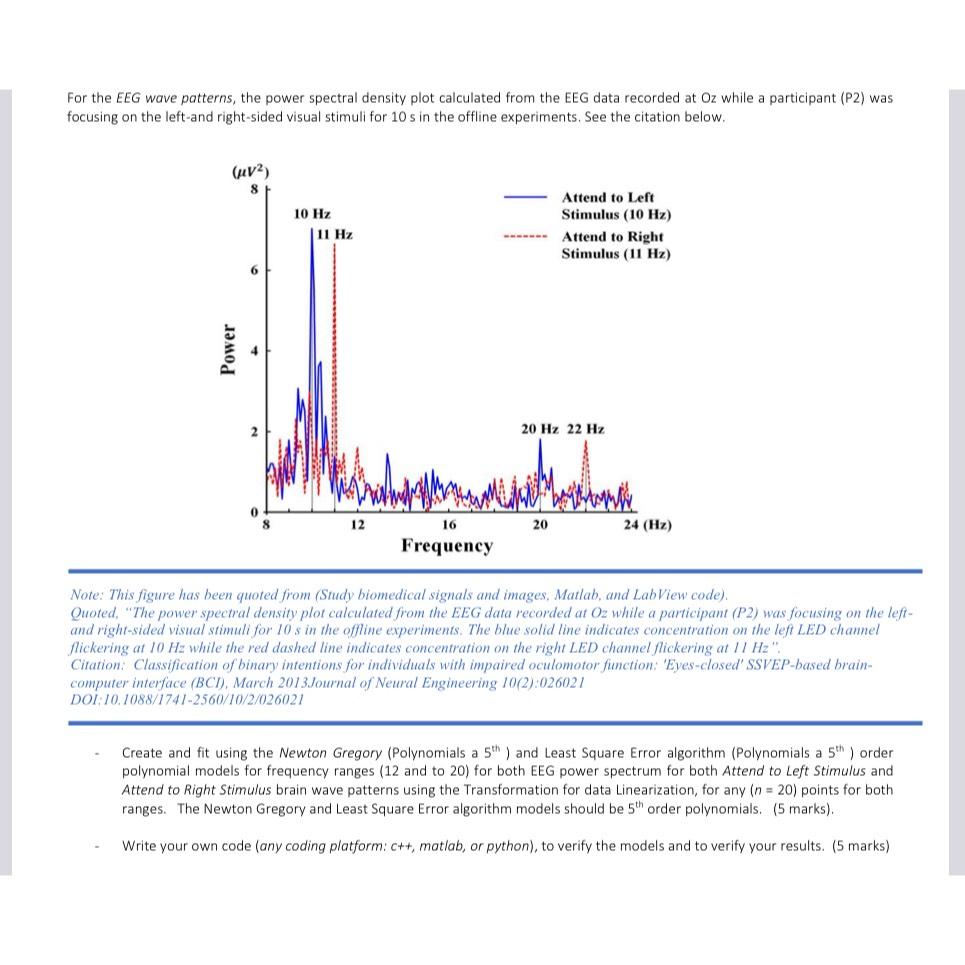
For the EEG wave patterns, the power spectral density plot calculated from the EEG data recorded at while a participant P was focusing on the leftand rightsided visual stimuli for in the offline experiments. See the citation below.
Note: This figure has been quoted from Study biomedical signals and images, Matlab, and LabView code
Quoted, "The power spectral density plot calculated from the EEG data recorded at while a participant was focusing on the leftand rightsided visual stimuli for in the offine experiments. The blue solid line indicates concentration on the left LED channel flickering at while the red dashed line indicates concentration on the right LED channel flickering at
Citation: Classification of binary intentions for individuals with impaired oculomotor function: 'Eyesclosed' SSVEPbased braincomputer interface BCI March Journal of Neural Engineering :
DOI:
Create and fit using the Newton Gregory Polynomials a and Least Square Error algorithm Polynomials a order polynomial models for frequency ranges and to for both EEG power spectrum for both Attend to Left Stimulus and Attend to Right Stimulus brain wave patterns using the Transformation for data Linearization, for any points for both ranges. The Newton Gregory and Least Square Error algorithm models should be order polynomials. marks
Write your own code any coding platform: c matlab, or python to verify the models and to verify your results. marks
Step by Step Solution
There are 3 Steps involved in it
1 Expert Approved Answer
Step: 1 Unlock

Question Has Been Solved by an Expert!
Get step-by-step solutions from verified subject matter experts
Step: 2 Unlock
Step: 3 Unlock