

Question: For the elevation, storage and outflow data shown below create the associated 2 S t + O chart. Plot the chart using 2 S t
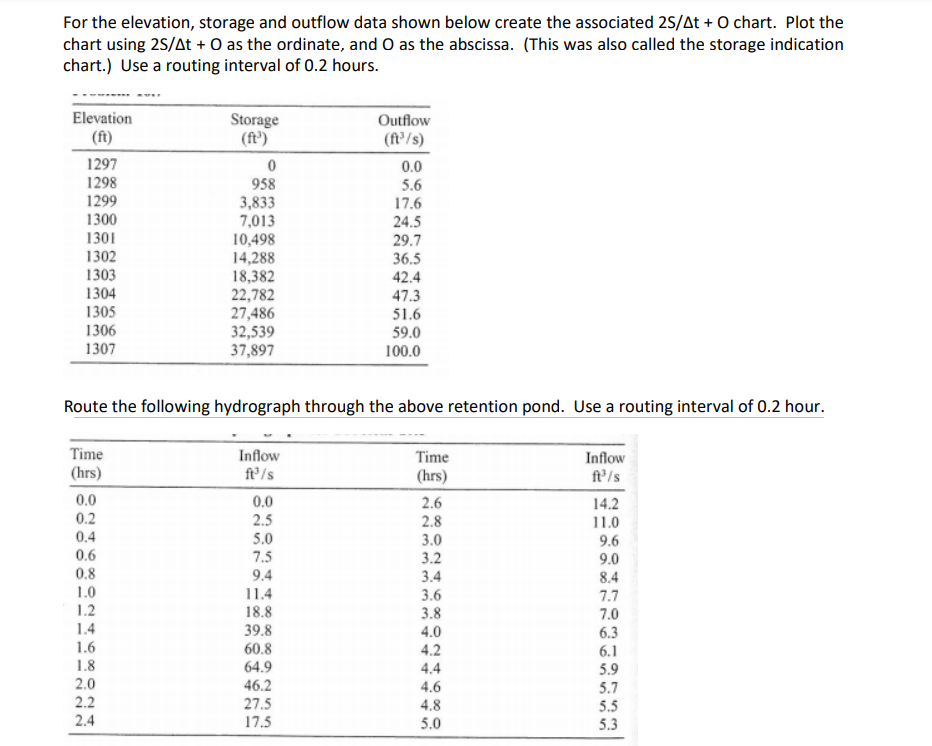
For the elevation, storage and outflow data shown below create the associated chart. Plot the chart using as the ordinate, and as the abscissaThis was also called the storage indication chart. Use a routing interval of hours.
Route the following hydrograph through the above retention pond. Use a routing interval of hours.
Step by Step Solution
There are 3 Steps involved in it
1 Expert Approved Answer
Step: 1 Unlock

Question Has Been Solved by an Expert!
Get step-by-step solutions from verified subject matter experts
Step: 2 Unlock
Step: 3 Unlock