

Question: For the exercises in this chapter, you will need the M-file dpzplot.n, which is in the Computer Explorations Toolbox. For convenience, the M-file is also
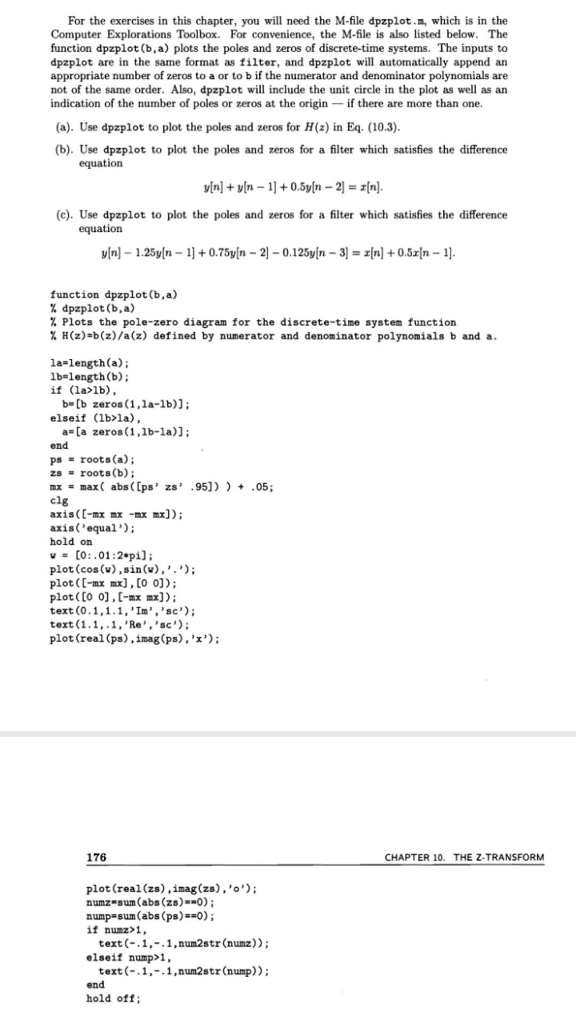
For the exercises in this chapter, you will need the M-file dpzplot.n, which is in the Computer Explorations Toolbox. For convenience, the M-file is also listed below. The function dpzplot (b,a) plots the poles and zeros of discrete-time systems. The inputs to dpzplot are in the same format as filter, and dpzplot will automatically append an appropriate number of zeros to a or to b if the numerator and denominator polynomials are not of the same order. Also, dpzplot will include the unit circle in the plot as well as an indication of the number of poles or zeros at the origin if there are more than one. (a). Use dpzplot to plot the poles and zeros for H(z) in Eq. (10.3) (b). Use dpzplot to plot the poles and zeros for a filter which satisfies the difference equation (c). Use dpzplot to plot the poles and zeros for a filter which satisfies the difference equation y[n]-1.25y|n-1] + 0.75V[n-2-0. 125y[n-3] = z[n] + 0.51[n-1]. function dpzplot (b,a) % dpaplot (ba) % Plots the pole-zero diagram for the discrete-time system function % H(z)=b(z)/a(z) defined by numerator and denominator polynomials b and a 1a-length(a) 1b-length (b) if (1a1b). b-[b zeros(1,la-1b) elseif (1b>la), a- [a zeros (1,1b-la)] end ps = roots(a); zs-roots(b); mx max( abs([ps, zs, .95]) ) + .05; axis(C-mx x -xx] axis('equal'); hold on v = [O : . 0 1 :2*pi); plot (cos),sin(),' ; plot (C-mxxo 0]); plot (o o]-xx]); text (0.1,1.1, 'Im', 'sc) text(1.1,1, 'Re, 'sc') plot (real (ps),imag (ps), 'x') 176 CHAPTER 10. THE Z TRANSFORM plot (real(zs),imag(zs), 'o') numz-sum(abs (zs) 0) nump=sum (abs (ps)s=0) ; if nunz>1, text (-.1,-.1,num2str (numz)) elseif nump>1, text (.1,-.1,num2str(nump)) end hold off
Step by Step Solution
There are 3 Steps involved in it

Get step-by-step solutions from verified subject matter experts