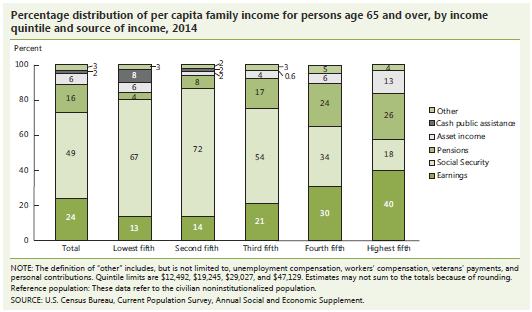
Question: For the figure below write one factual statement that represents the data that are shown: Statement 1: Percentage distribution of per capita family income for
For the figure below write one factual statement that represents the data that are shown:
Statement 1:
Percentage distribution of per capita family income for persons age 65 and over, by income quintile and source of income, 2014 Percent 100 3 5 6 B B 13 17 80 16 24 26 0 Other Cash public assistance 60 O Asset income 49 72 O Pensions 67 54 34 18 O Social Security 40 O Earnings 20 40 24 30 21 14 0 Total Lowest fifth Second fifth Third fifth Fourth fifth Highest fifth NOTE: The definition of "other" includes, but is not limited to, unemployment compensation, workers' compensation, veterans payments, and personal contributions. Quintile limits are $12,492, $19,245, $29,027, and $47,129. Estimates may not sum to the totals because of rounding. Reference population: These date refer to the civilian noninstitutionalized population. SOURCE: U.5. Census Bureau, Current Population Survey, Annual Social and Economic Supplement
Step by Step Solution
There are 3 Steps involved in it
1 Expert Approved Answer
Step: 1 Unlock
Question Has Been Solved by an Expert!
Get step-by-step solutions from verified subject matter experts
Step: 2 Unlock
Step: 3 Unlock
Students Have Also Explored These Related Mathematics Questions!