

Question: For the first table use the example of how to write about your results on page 107 in SPSS for Introductory Statistics , and explain
For the first table use the "example of how to write about your results" on page 107 in SPSS for Introductory Statistics, and explain your results. You do not need to include the X2 or the df values or the last two sentences about Phi in your writing. Use the directions in Appendix C for creating an APA formatted table to go along with your writing.
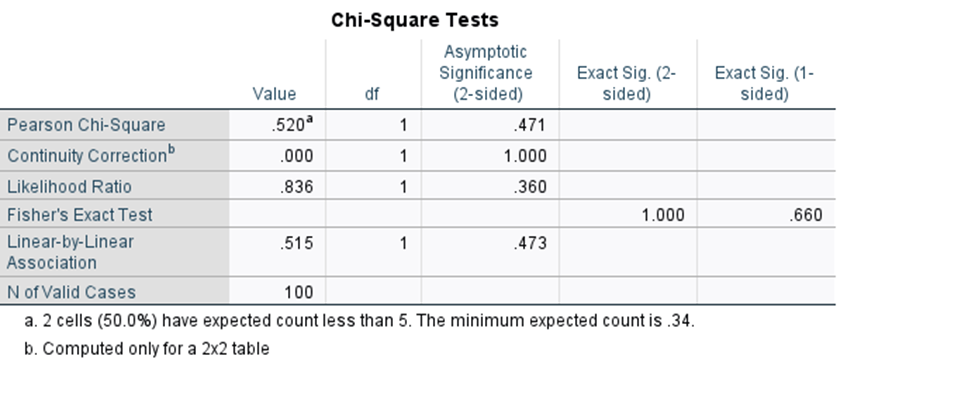
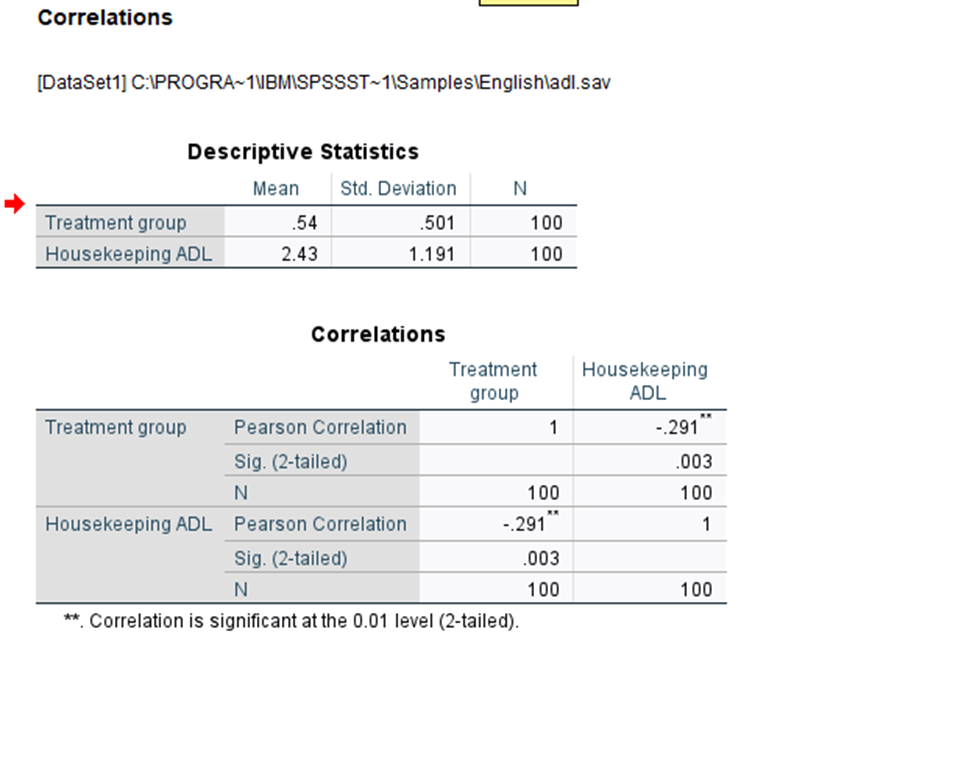
Chi-Square Tests Asymptotic Significance Exact Sig. (2- Exact Sig. (1- Value df (2-sided) sided) sided) Pearson Chi-Square .520 .471 Continuity Correction 000 1.000 Likelihood Ratio 836 .360 Fisher's Exact Test 1.000 .660 Linear-by-Linear .515 .473 Association N of Valid Cases 100 a. 2 cells (50.0%) have expected count less than 5. The minimum expected count is .34. b. Computed only for a 2x2 tableCorrelations [DataSet1] C:\\PROGRA~1\\BM\\SPSSST~1\\Samples\\English\\adl.sav Descriptive Statistics Mean Std. Deviation N Treatment group .54 501 100 Housekeeping ADL 2.43 1.191 100 Correlations Treatment Housekeeping group ADL Treatment group Pearson Correlation -.291 Sig. (2-tailed) 003 N 100 100 Housekeeping ADL Pearson Correlation -.291 1 Sig. (2-tailed) 003 N 100 100 ** Correlation is significant at the 0.01 level (2-tailed)
Step by Step Solution
There are 3 Steps involved in it

Get step-by-step solutions from verified subject matter experts