

For the following chart, the left column is Walmart and the right column is CVS. Both have
Fantastic news! We've Found the answer you've been seeking!
Question:
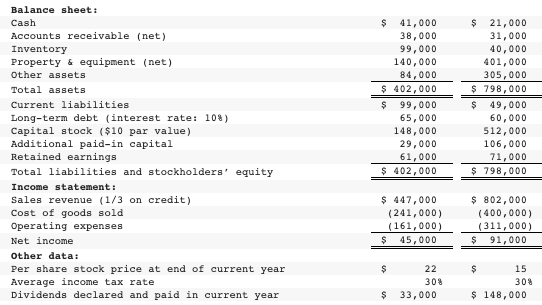
For the following chart, the left column is Walmart and the right column is CVS. Both have been in business for 10 years with steady growth but each business has a different viewpoint in many respects. Walmart is more conservative, and as its president has said, ?We avoid what we consider to be undue risk.? Neither company is publicly held. Create a schedule that shows ratio analysis for Walmart and CVS (show work if needed).
| WALMART | CVS | ||||
| Profitability Ratio | |||||
| 1. | Return on equity | % | % | ||
| 2 | Return on assets | % | % | ||
| 3 | Gross profit percentage | % | % | ||
| 4 | Net profit margin | % | % | ||
| 5 | Earnings per share | ||||
| 6 | Quality of income | ||||
| Asset Turnover Ratio | |||||
| 7 | Total asset turnover | ||||
| 8 | Fixed asset turnover | ||||
| 9 | Receivable turnover | ||||
| 10 | Inventory turnover | ||||
| Liquidity Ratio | |||||
| 11 | Current ratio | ||||
| 12 | Quick ratio | ||||
| 13 | Cash ratio | ||||
| Solvency Ratio | |||||
| 14 | Times interest earned ratio | ||||
| 15 | Cash coverage ratio | ||||
| 16 | Debt/equity ratio | ||||
| Market Ratio | |||||
| 17 | Price/earnings ratio | ||||
| 18 | Dividend yield ratio | % | % | ||
Expert Answer:
Profitability Ratio Formula Walmart CVS Calculation Figures in Ratio Calculation Ratio Return on equity Net IncomeAverage Shareholders equity 45000148... View the full answer

Related Book For 

Elementary Statistics
ISBN: 978-0538733502
11th edition
Authors: Robert R. Johnson, Patricia J. Kuby
Posted Date:
