

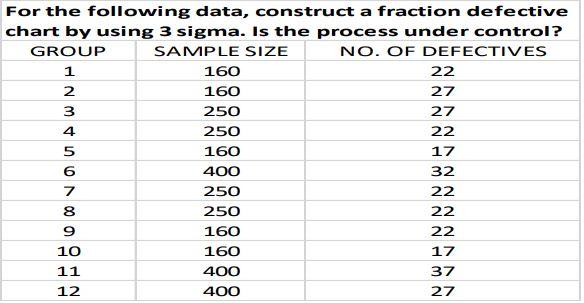
Question: For the following data, construct a fraction defective chart by using 3 sigma. Is the process under control? GROUP SAMPLE SIZE NO. OF DEFECTIVES 1
Step by Step Solution
There are 3 Steps involved in it
1 Expert Approved Answer
Step: 1 Unlock

Question Has Been Solved by an Expert!
Get step-by-step solutions from verified subject matter experts
Step: 2 Unlock
Step: 3 Unlock