

Question: For the following graphs please indicate: The type of function being represented The values for the variables in the function (as specified under the type
For the following graphs please indicate:
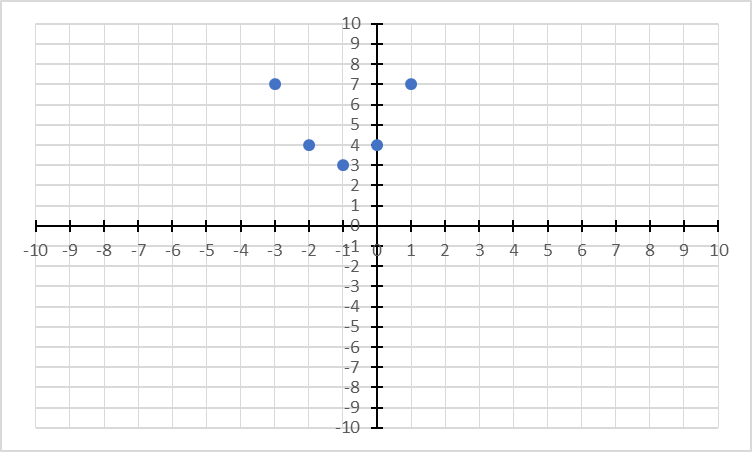
- The type of function being represented
- The values for the variables in the function (as specified under the type of graph)
- The equation of the function shown by the graph
- A table of values for points on a graph from your equation
- Graph your function on the same grid as the points given
- What scenario could be represented by this graph? Give a specific example.
Note: checking off more than one type of function will give you a mark of 0 for that graph.
Recall:
Constant Function | y = a | |||
Linear Function | y = ax + b | |||
Quadratic Function | y = a (x - h)2 + k | |||
Cubic Function | y = a (x - h)3 + k | |||
Exponential Function | y = a (b)x-h + k | |||
Logarithmic Function | y = a log(x - h) + k | |||
Sinusoidal Function | y = a sin(b(x - h) + k | ( b = 1 for the sinusodial function) |

\f\f
Step by Step Solution
There are 3 Steps involved in it
1 Expert Approved Answer
Step: 1 Unlock

Question Has Been Solved by an Expert!
Get step-by-step solutions from verified subject matter experts
Step: 2 Unlock
Step: 3 Unlock