

Question: For the following hypothesis test. 1) write the claim and opposite in symbolic form next to Ho and H1. 2) nd the critical value(s) on
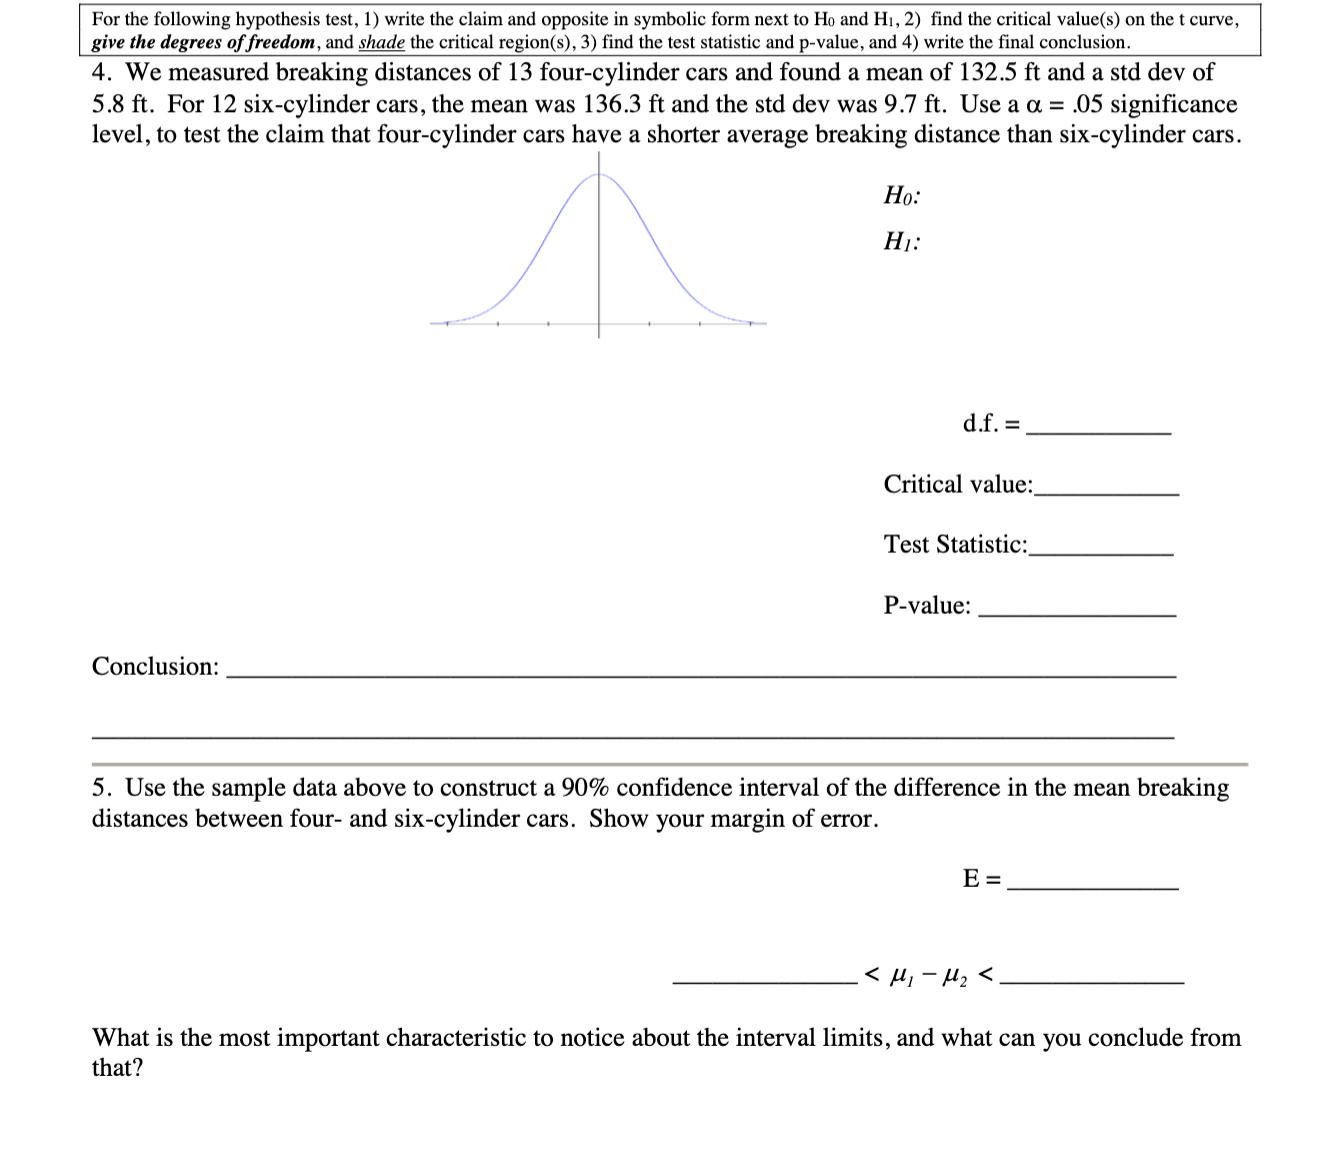
For the following hypothesis test. 1) write the claim and opposite in symbolic form next to Ho and H1. 2) nd the critical value(s) on the t curve. give the degrees of freedom. and shade the critical region(s), 3) find the test statistic and pvalue, and 4) write the nal conclusion. 4. We measured breaking distances of 13 four-cylinder cars and found a mean of 132.5 ft and a std dev of 5.8 ft. For 12 six-cylinder cars, the mean was 136.3 ft and the std dev was 9.7 ft. Use a or = .05 signicance level, to test the claim that four-cylinder cars have a shorter average breaking distance than six-cylinder cars. H0: H1 .' d.f. = Critical value: Test Statistic: P-value: Conclusion: 5. Use the sample data above to construct a 90% condence interval of the difference in the mean breaking distances between four- and six-cylinder cars. Show your margin of error.
Step by Step Solution
There are 3 Steps involved in it

Get step-by-step solutions from verified subject matter experts