

Question: For the following problem use the Three graphs we have developed that show (a) the relationship between savings and investment and r*in the ROW, (b)
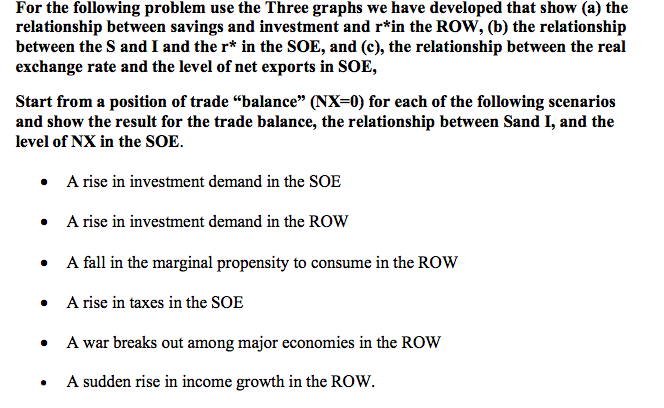
For the following problem use the Three graphs we have developed that show (a) the relationship between savings and investment and r*in the ROW, (b) the relationship between the S and I and the r* in the SOE, and (c), the relationship between the real exchange rate and the level of net exports in SOE, Start from a position of trade "balance" (NX=0) for each of the following scenarios and show the result for the trade balance, the relationship between Sand I, and the level of NX in the SOE. . A rise in investment demand in the SOE . A rise in investment demand in the ROW . A fall in the marginal propensity to consume in the ROW . A rise in taxes in the SOE . A war breaks out among major economies in the ROW . A sudden rise in income growth in the ROW
Step by Step Solution
There are 3 Steps involved in it

Get step-by-step solutions from verified subject matter experts