

Question: For the following table of data, a. Draw a scatterplot b. Calculate the correlation coefficient c. Calculate the least squares line and graph it
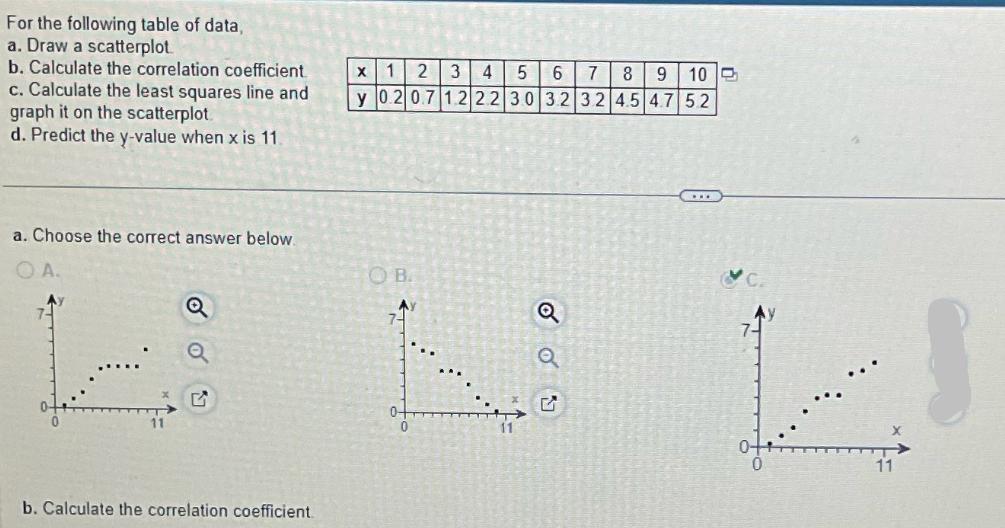
For the following table of data, a. Draw a scatterplot b. Calculate the correlation coefficient c. Calculate the least squares line and graph it on the scatterplot d. Predict the y-value when x is 11. a. Choose the correct answer below. A. b. Calculate the correlation coefficient. X 1 2 3 4 5 6 7 8 9 10 y 0.2 0.7 1.2 22 30 32 32 45 47 52 OB. 0- 0 Q U L 11
Step by Step Solution
There are 3 Steps involved in it
1 Expert Approved Answer
Step: 1 Unlock

Question Has Been Solved by an Expert!
Get step-by-step solutions from verified subject matter experts
Step: 2 Unlock
Step: 3 Unlock