

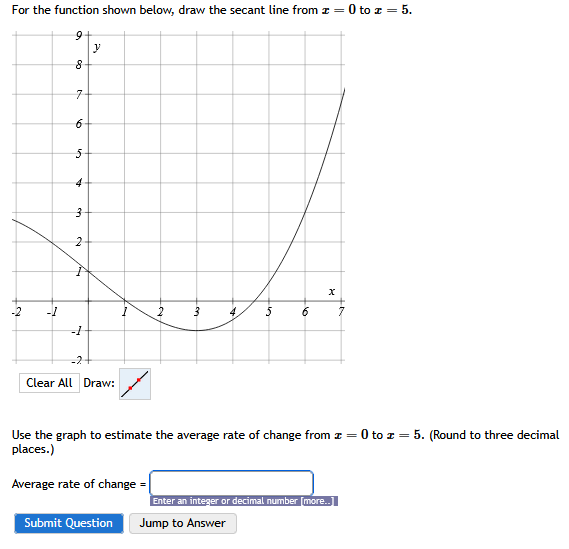
Question: For the function shown below, draw the secant line from x = 0 t o x = 5 . Use the graph t o estimate
For the function shown below, draw the secant line from
Use the graph estimate the average rate change from three decimal places.
Average rate change
Enter integer decimal number more..I. And how I graph?
Step by Step Solution
There are 3 Steps involved in it
1 Expert Approved Answer
Step: 1 Unlock

Question Has Been Solved by an Expert!
Get step-by-step solutions from verified subject matter experts
Step: 2 Unlock
Step: 3 Unlock