

Question: for the given data set up the appropriate chart for the orange juice concentrate, stating whether the process is in control. The number of observations
for the given data set up the appropriate chart for the orange juice concentrate, stating whether the process is in control. The number of observations is 50 per sample
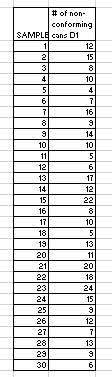
\begin{tabular}{|r|r|} \hline SAMPL & #ofnon-conformingconsD1 \\ \hline 1 & 12 \\ \hline 2 & 15 \\ \hline 3 & 8 \\ \hline 4 & 10 \\ \hline 5 & 4 \\ \hline 6 & 7 \\ \hline 7 & 16 \\ \hline 8 & 9 \\ \hline 9 & 14 \\ \hline 10 & 10 \\ \hline 11 & 5 \\ \hline 12 & 6 \\ \hline 13 & 17 \\ \hline 14 & 12 \\ \hline 15 & 22 \\ \hline 16 & 8 \\ \hline 17 & 10 \\ \hline 18 & 5 \\ \hline 19 & 13 \\ \hline 20 & 11 \\ \hline 21 & 20 \\ \hline 22 & 18 \\ \hline 23 & 24 \\ \hline 24 & 15 \\ \hline 25 & 9 \\ \hline 26 & 12 \\ \hline 27 & 7 \\ \hline 28 & 13 \\ \hline 29 & 9 \\ \hline 30 & 6 \\ \hline \end{tabular}
Step by Step Solution
There are 3 Steps involved in it

Get step-by-step solutions from verified subject matter experts