

Question: For the given data, the x double overbar x =____ inches (round your response to four decimal places). Based on the sampling done, the control
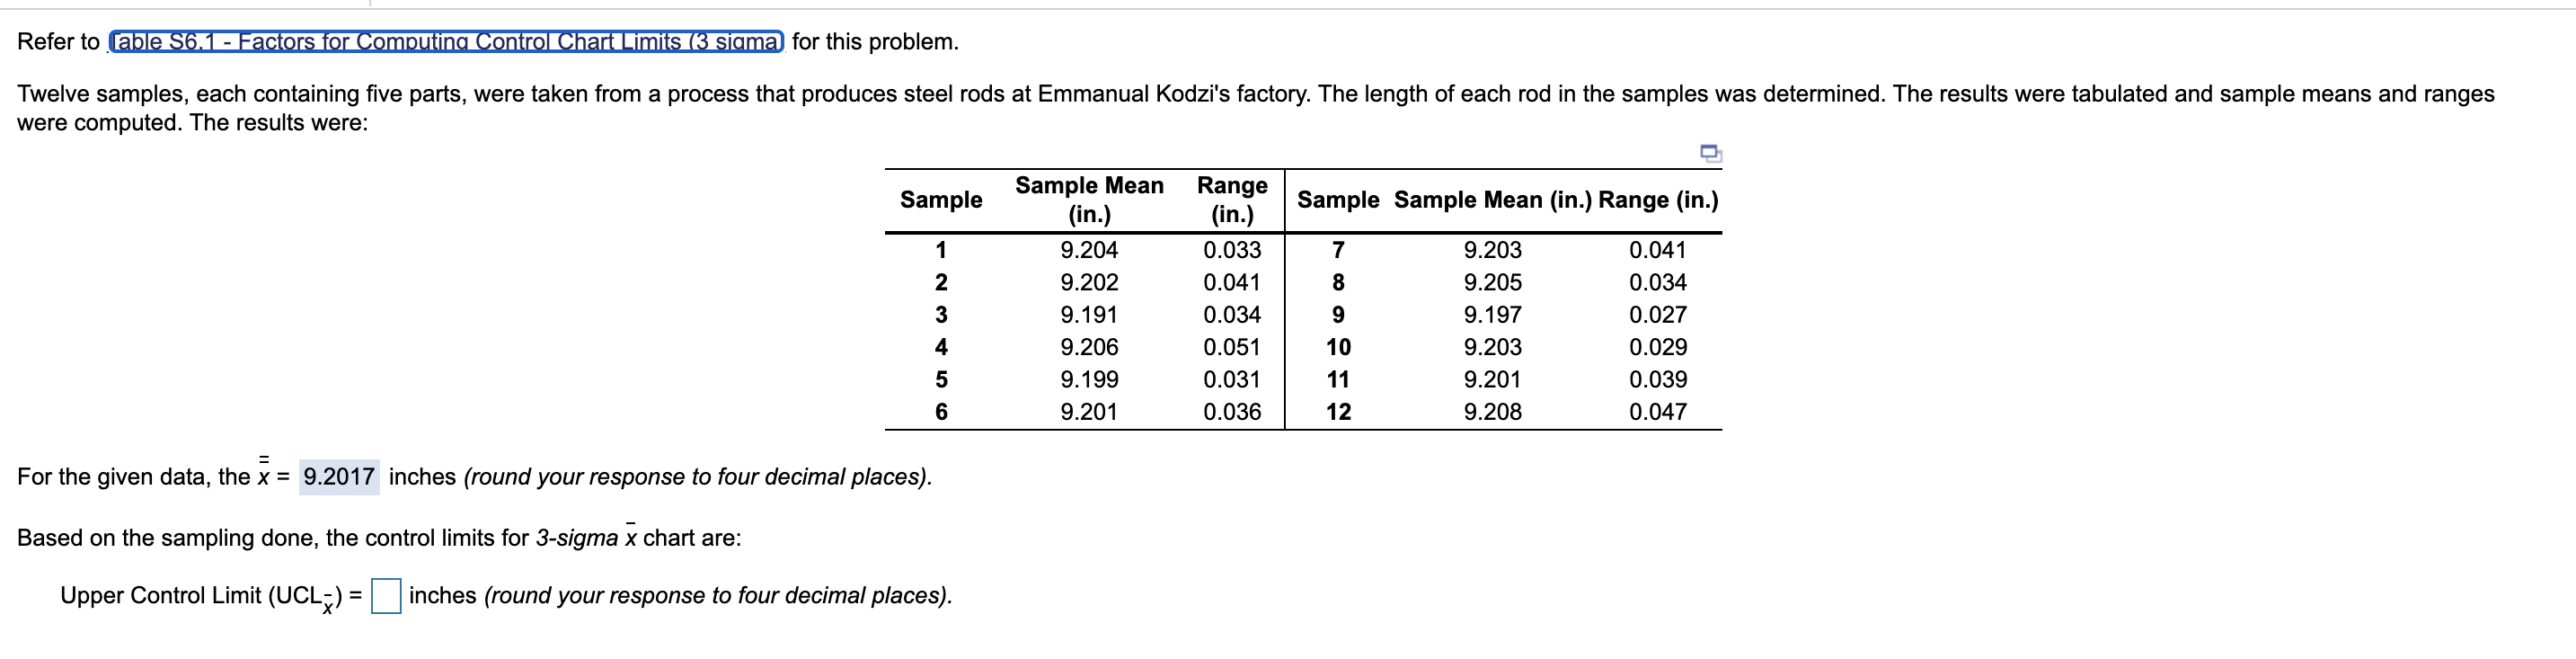
For the given data, the x double overbarx =____ inches (round your response to four decimal places).
Based on the sampling done, the control limits for 3-sigma x overbarx chart are:
Upper Control Limit (UCL Subscript x overbarUCLx )= ____ inches (round your response to four decimal places).
Lower Control Limit (LCL Subscript x overbarLCLx )=______ inches (round your response to four decimal places).
Based on the x overbarx -chart, is one or more samples beyond the control limits? Yes or No
For the given data, the, Upper R overbarR =___ inches (round your response to four decimal places).
The control limits for the 3-sigma R-chart are:
Upper Control Limit (UCL Subscript Upper RUCLR ) =____ inches (round your response to four decimal places).
Lower Control Limit (LCL Subscript Upper RLCLR )= _____ inches (round your response to four decimal places).
Based on the R-chart, is one or more samples beyond the control limits? Yes or No
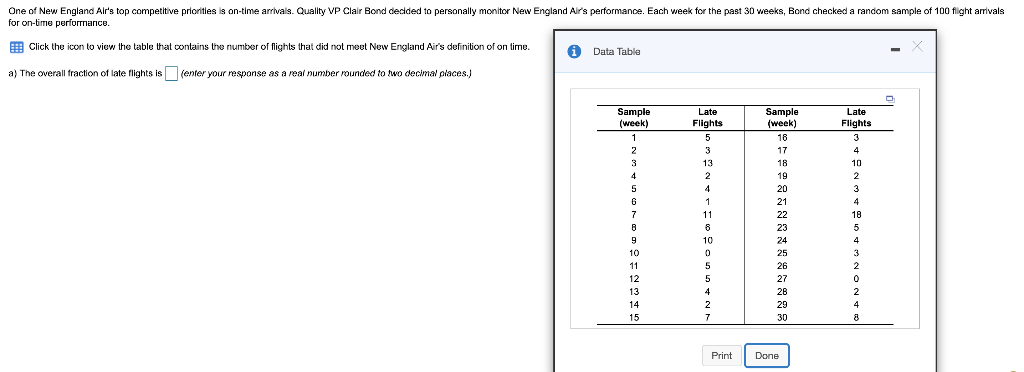
) The overall fraction of late flights is__________? (enter response as a real number rounded to two decimal places)
2) Do all samples fall within New England's Air control limits? Yes/No
2) What can Clair Bond report about the quality of service?
a) Clair needs to report that the airline meets boths its own standards and the industry standards.
b) Clair needs to report that the airline meets neither its own standards nor the industry standards.
c) Clair needs to report that the airline meets its own standards, but doesn't meet the industry standards.
d) Clair needs to report that the airline meets the industry standards, but doesn' t meet its own standards
Refer to able 56.1 - Factors for Computing Control Chart Limits (3 siama for this problem. Twelve samples, each containing five parts, were taken from a process that produces steel rods at Emmanual Kodzi's factory. The length of each rod in the samples was determined. The results were tabulated and sample means and ranges were computed. The results were: Sample Sample Sample Mean (in.) Range (in.) 1 7 2 8 Sample Mean (in.) 9.204 9.202 9.191 9.206 9.199 9.201 Range (in.) 0.033 0.041 0.034 0.051 0.031 0.036 3 9 9.203 9.205 9.197 9.203 9.201 9.208 0.041 0.034 0.027 0.029 0.039 0.047 4 5 10 11 6 12 For the given data, the x = 9.2017 inches (round your response to four decimal places). Based on the sampling done, the control limits for 3-sigma x chart are: Upper Control Limit (UCL ) = inches (round your response to four decimal places). One of New England Air's top competitive priorities is on-time arrivals. Quality VP Clair Bond decided to personally monitor New England Ali's performance. Each week for the past 30 weeks, Bond checked a random sample of 100 flight arrivals for on-time performance. Click the icon to view the table that contains the number of flights that did not meet New England Air's definition of on time. i Data Table a) The overall fraction of late flights is jenter your response as a real number rounded to two decimal places.) Sample (week) Sample (week) Late Flights 1 2 3 4 5 5 18 17 18 3 4 10 2 Late Flights 5 3 13 2 4 4 1 1 11 8 10 0 3 6 7 B 9 10 19 20 21 22 23 24 25 26 27 2B 29 30 4 18 5 4 3 2 11 12 13 14 15 5 5 5 4 2 7 2 4 8 Print DoneStep by Step Solution
There are 3 Steps involved in it

Get step-by-step solutions from verified subject matter experts