

Question: For the given data, the x= inches (round your response fo four decimal places) Based on the sampling done, the control limits for 3 sigma
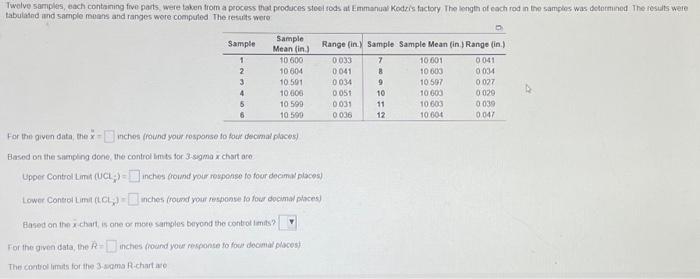
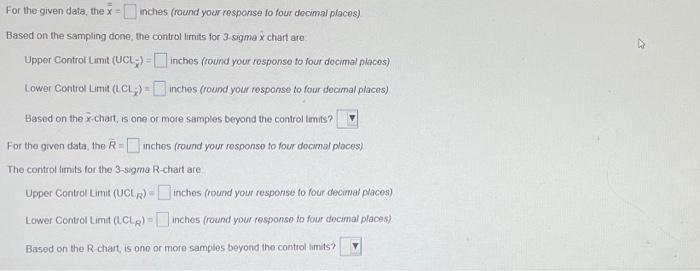
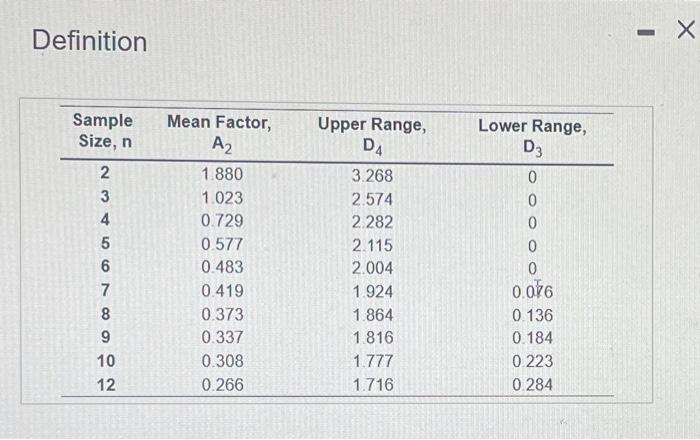
For the given data, the x= inches (round your response fo four decimal places) Based on the sampling done, the control limits for 3 sigma x chart are. Upper Control Limit (UCLx)= inches (round your response to four docimal places) Lower Control Limat (LCLx)= inchos (round your response to four decimal places) Based on the x-chart, is one or more samples beyond the control timits? For the given data, the R= inches (round your response to four docmal places) The control limsts for the 3-sigma R-chart are Upper Control Limit (UCLR)= inches (round your response to four decimal places) Lower Control Limit (LClR)= inches (round your responso fo four decimal places) Based on the R-chart, is one or more samples beyond the control limts? Definition For the given data, the x - inches (round your rosponse to fock docmat places.) Basod on the siarnding done, the control timts for 3 -sigma x chart are. Lower Conteof Lima (LCLx) = inches (round your response fo four docimal phaces) Based on the x-chart, is one or moce samples beryod the control imits? For the given data, the R= inches gound your response fo fout deomar places): The contros limats for the 3-sams R-chart ave
Step by Step Solution
There are 3 Steps involved in it

Get step-by-step solutions from verified subject matter experts