

Question: For the Glitch problems, assume the K-Map is the same format we've been using, AB values on the left side, CD values along the top.
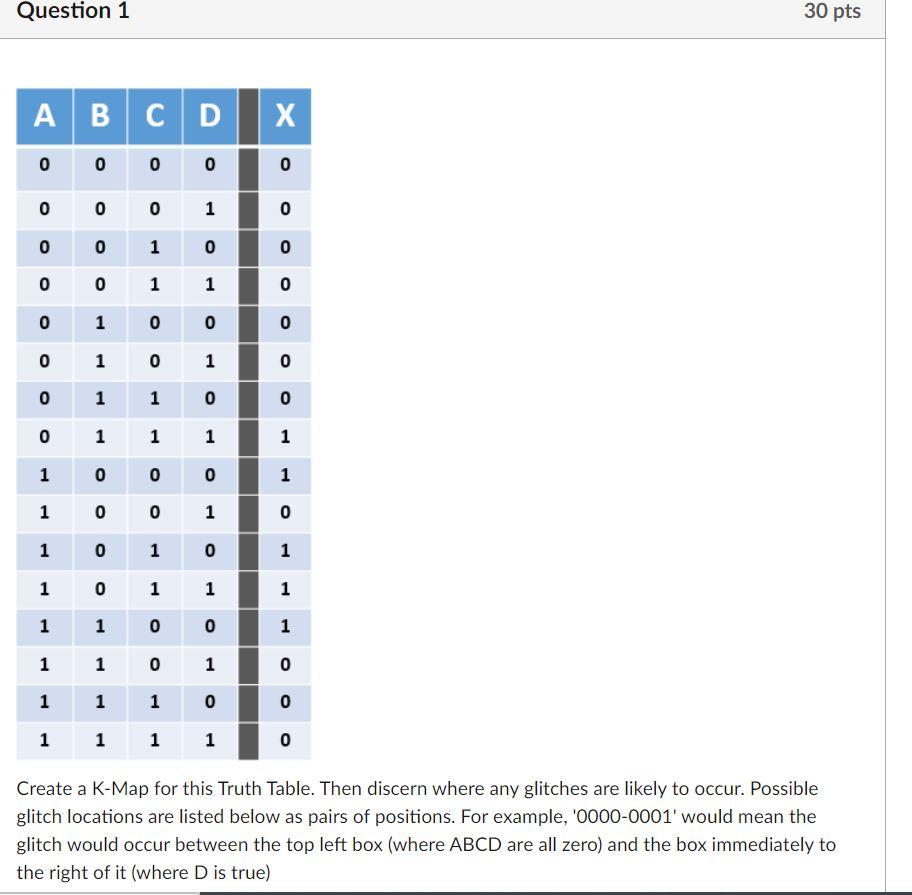
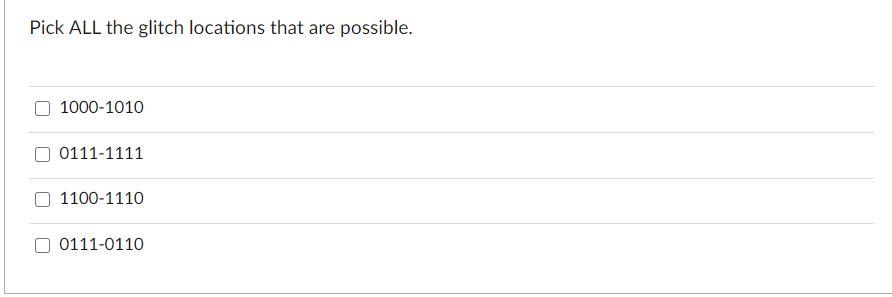
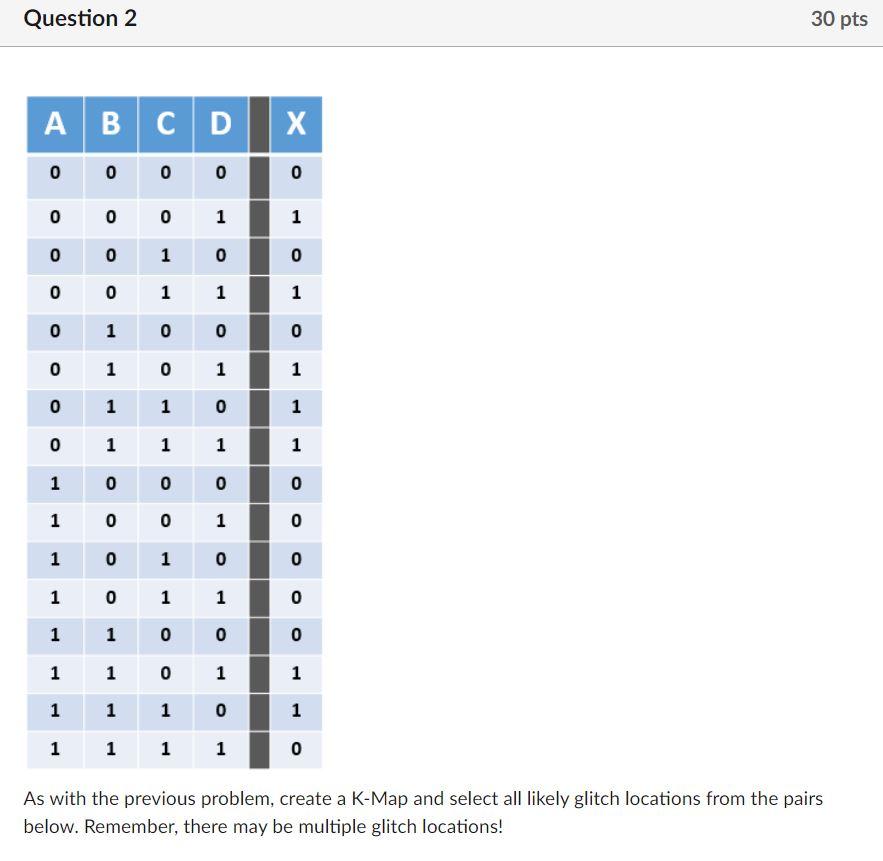
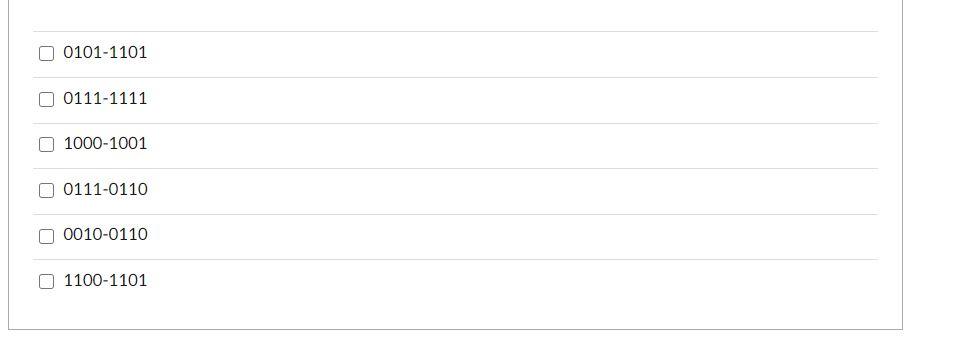
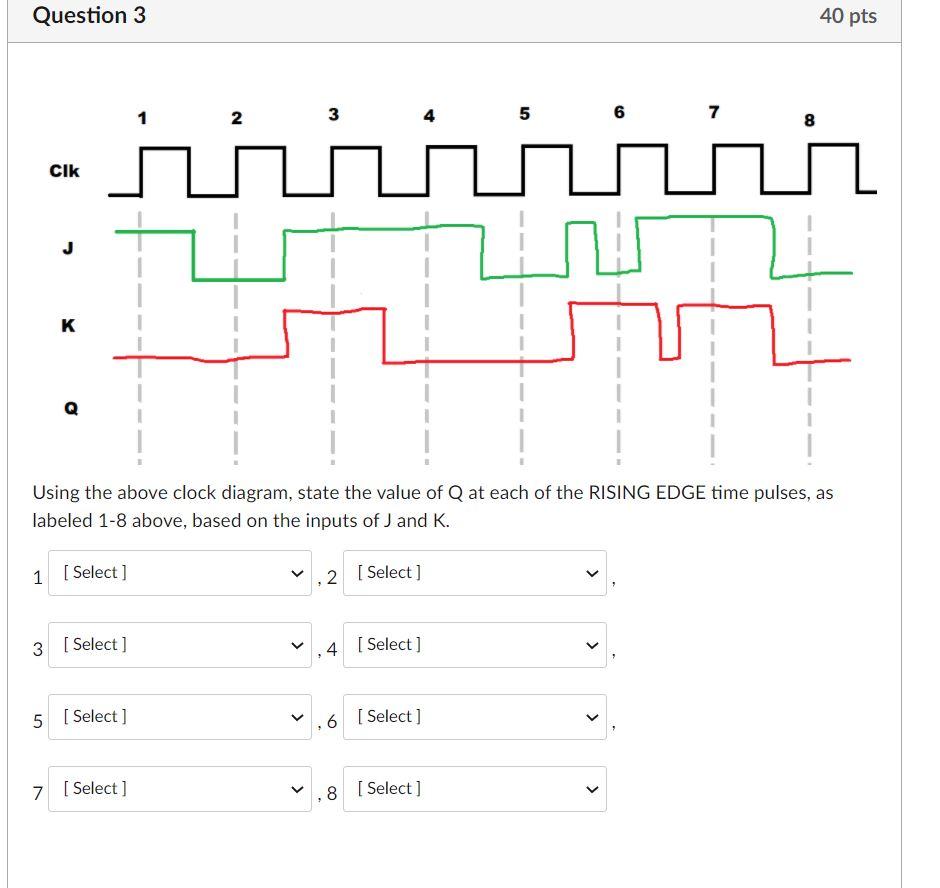
For the Glitch problems, assume the K-Map is the same format we've been using, AB values on the left side, CD values along the top. Question 1 30 pts A B C D 0 0 0 0 O o 0 0 1 0 o 0 1 0 o 0 0 1 1 0 O 1 0 0 0 0 1 0 1 0 0 1 1 1 0 0 0 1 1 1 1 1 0 0 0 1 1 1 1 1 0 0 1 0 1 0 1 0 1 1 0 1 1 1 1 1 0 0 1 1 1 1 0 1 0 1 1 1 o 0 1 1 1 1 0 Create a K-Map for this Truth Table. Then discern where any glitches are likely to occur. Possible glitch locations are listed below as pairs of positions. For example, '0000-0001' would mean the glitch would occur between the top left box (where ABCD are all zero) and the box immediately to the right of it (where D is true) Pick ALL the glitch locations that are possible. 1000-1010 0111-1111 1100-1110 0111-0110 Question 2 30 pts A B C D X 0 0 0 0 0 0 0 0 1 1 0 0 1 O 0 0 0 1 1 1 1 0 1 0 0 0 0 1 0 1 1 0 1 1 0 1 0 1 1 1 1 1 0 0 O 0 1 0 0 1 0 1 0 1 0 0 1 0 1 1 0 1 1 0 0 0 1 1 0 1 1 1 1 1 0 1 1 1 1 1 0 As with the previous problem, create a K-Map and select all likely glitch locations from the pairs below. Remember, there may be multiple glitch locations! O 0101-1101 O 0111-1111 1000-1001 O 0111-0110 O 0010-0110 1100-1101 Question 3 40 pts Clk K Using the above clock diagram, state the value of Q at each of the RISING EDGE time pulses, as labeled 1-8 above, based on the inputs of J and K. 1 [Select) | ,2 [Select) 3 [Select] > 4 [ Select) 5 [Select) KI 6 [Select) K 7 [Select] 8 [Select)
Step by Step Solution
There are 3 Steps involved in it

Get step-by-step solutions from verified subject matter experts