

Question: For the graph section, please plot in excel and state the coordinates. Then answer the following question. L.P. Model: 1.) Plot and label the constraints
For the graph section, please plot in excel and state the coordinates. Then answer the following question. 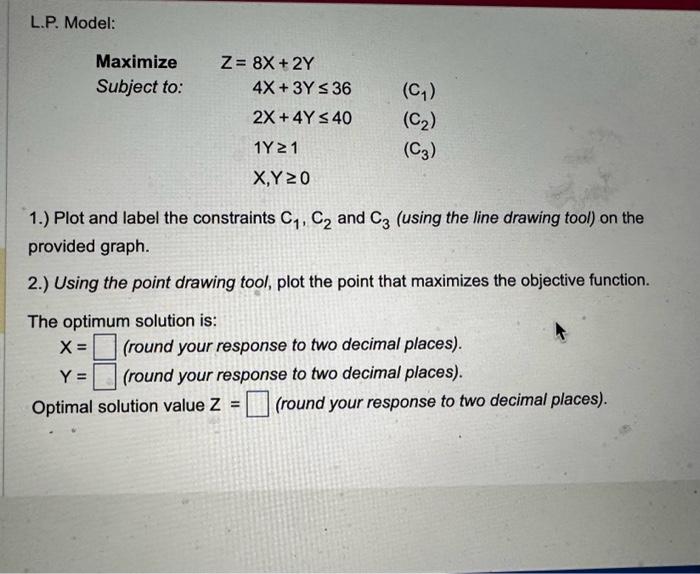
L.P. Model: 1.) Plot and label the constraints C1,C2 and C3 (using the line drawing tool) on the provided graph. 2.) Using the point drawing tool, plot the point that maximizes the objective function. The optimum solution is: X= (round your response to two decimal places). Y= (round your response to two decimal places). Optimal solution value Z = (round your response to two decimal places)
Step by Step Solution
There are 3 Steps involved in it
1 Expert Approved Answer
Step: 1 Unlock

Question Has Been Solved by an Expert!
Get step-by-step solutions from verified subject matter experts
Step: 2 Unlock
Step: 3 Unlock