

Question: For the half - wave rectifier circuit illustrated in Figure 3 assume that there is a 0 . 7 V drop across the diode when
For the halfwave rectifier circuit illustrated in Figure assume that there is a V drop across the diode when it is forward biased.
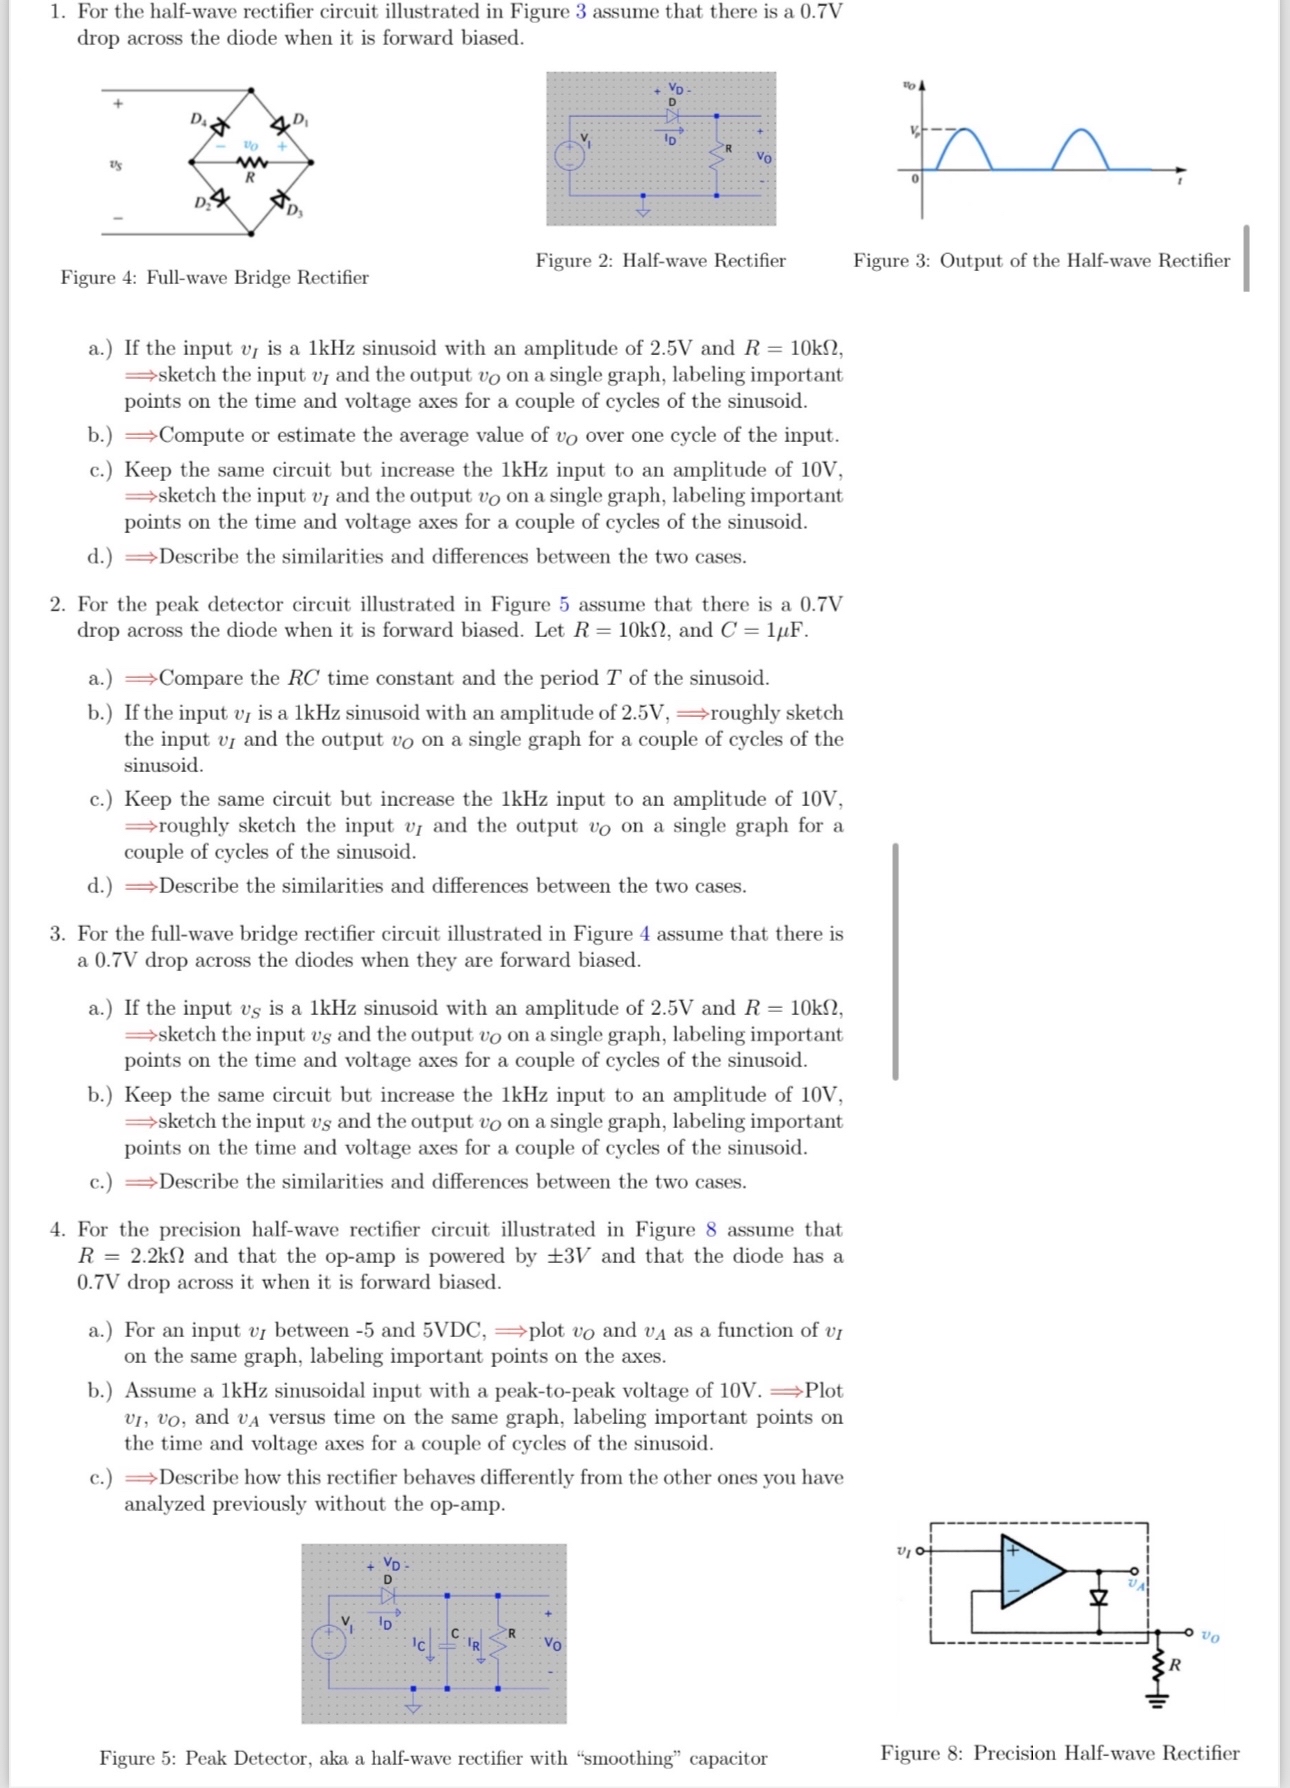
Figure : Fullwave Bridge Rectifier
Figure : Halfwave Rectifier
Figure : Output of the Halfwave Rectifier
a If the input is a kHz sinusoid with an amplitude of V and Longrightarrow sketch the input and the output on a single graph, labeling important points on the time and voltage axes for a couple of cycles of the sinusoid
b Longrightarrow Compute or estimate the average value of over one cycle of the input.
c Keep the same circuit but increase the kHz input to an amplitude of V Longrightarrow sketch the input and the output on a single graph, labeling important points on the time and voltage axes for a couple of cycles of the sinusoid
d Longrightarrow Describe the similarities and differences between the two cases.
For the peak detector circuit illustrated in Figure assume that there is a V drop across the diode when it is forward biased. Let and
a Longrightarrow Compare the time constant and the period of the sinusoid
b If the input is a kHz sinusoid with an amplitude of Longrightarrow roughly sketch the input and the output on a single graph for a couple of cycles of the sinusoid
c Keep the same circuit but increase the kHz input to an amplitude of V Longrightarrow roughly sketch the input and the output on a single graph for a couple of cycles of the sinusoid
d Longrightarrow Describe the similarities and differences between the two cases.
For the fullwave bridge rectifier circuit illustrated in Figure assume that there is a V drop across the diodes when they are forward biased.
a If the input is a kHz sinusoid with an amplitude of V and Longrightarrow sketch the input and the output on a single graph, labeling important points on the time and voltage axes for a couple of cycles of the sinusoid
b Keep the same circuit but increase the kHz input to an amplitude of V Longrightarrow sketch the input and the output on a single graph, labeling important points on the time and voltage axes for a couple of cycles of the sinusoid
c Longrightarrow Describe the similarities and differences between the two cases.
For the precision halfwave rectifier circuit illustrated in Figure assume that and that the opamp is powered by and that the diode has a V drop across it when it is forward biased.
a For an input between and Longrightarrow plot and as a function of on the same graph, labeling important points on the axes.
b Assume a kHz sinusoidal input with a peaktopeak voltage of Longrightarrow Plot and versus time on the same graph, labeling important points on the time and voltage axes for a couple of cycles of the sinusoid
c Longrightarrow Describe how this rectifier behaves differently from the other ones you have analyzed previously without the opamp.
Figure : Peak Detector, aka a halfwave rectifier with "smoothing" capacitor
Figure : Precision Halfwave Rectifier. Please draw all sketch
Step by Step Solution
There are 3 Steps involved in it
1 Expert Approved Answer
Step: 1 Unlock

Question Has Been Solved by an Expert!
Get step-by-step solutions from verified subject matter experts
Step: 2 Unlock
Step: 3 Unlock