

Question: For the levelling network shown in Figure 2 , estimate the most probable elevations for x , Y , and Z . The observed values
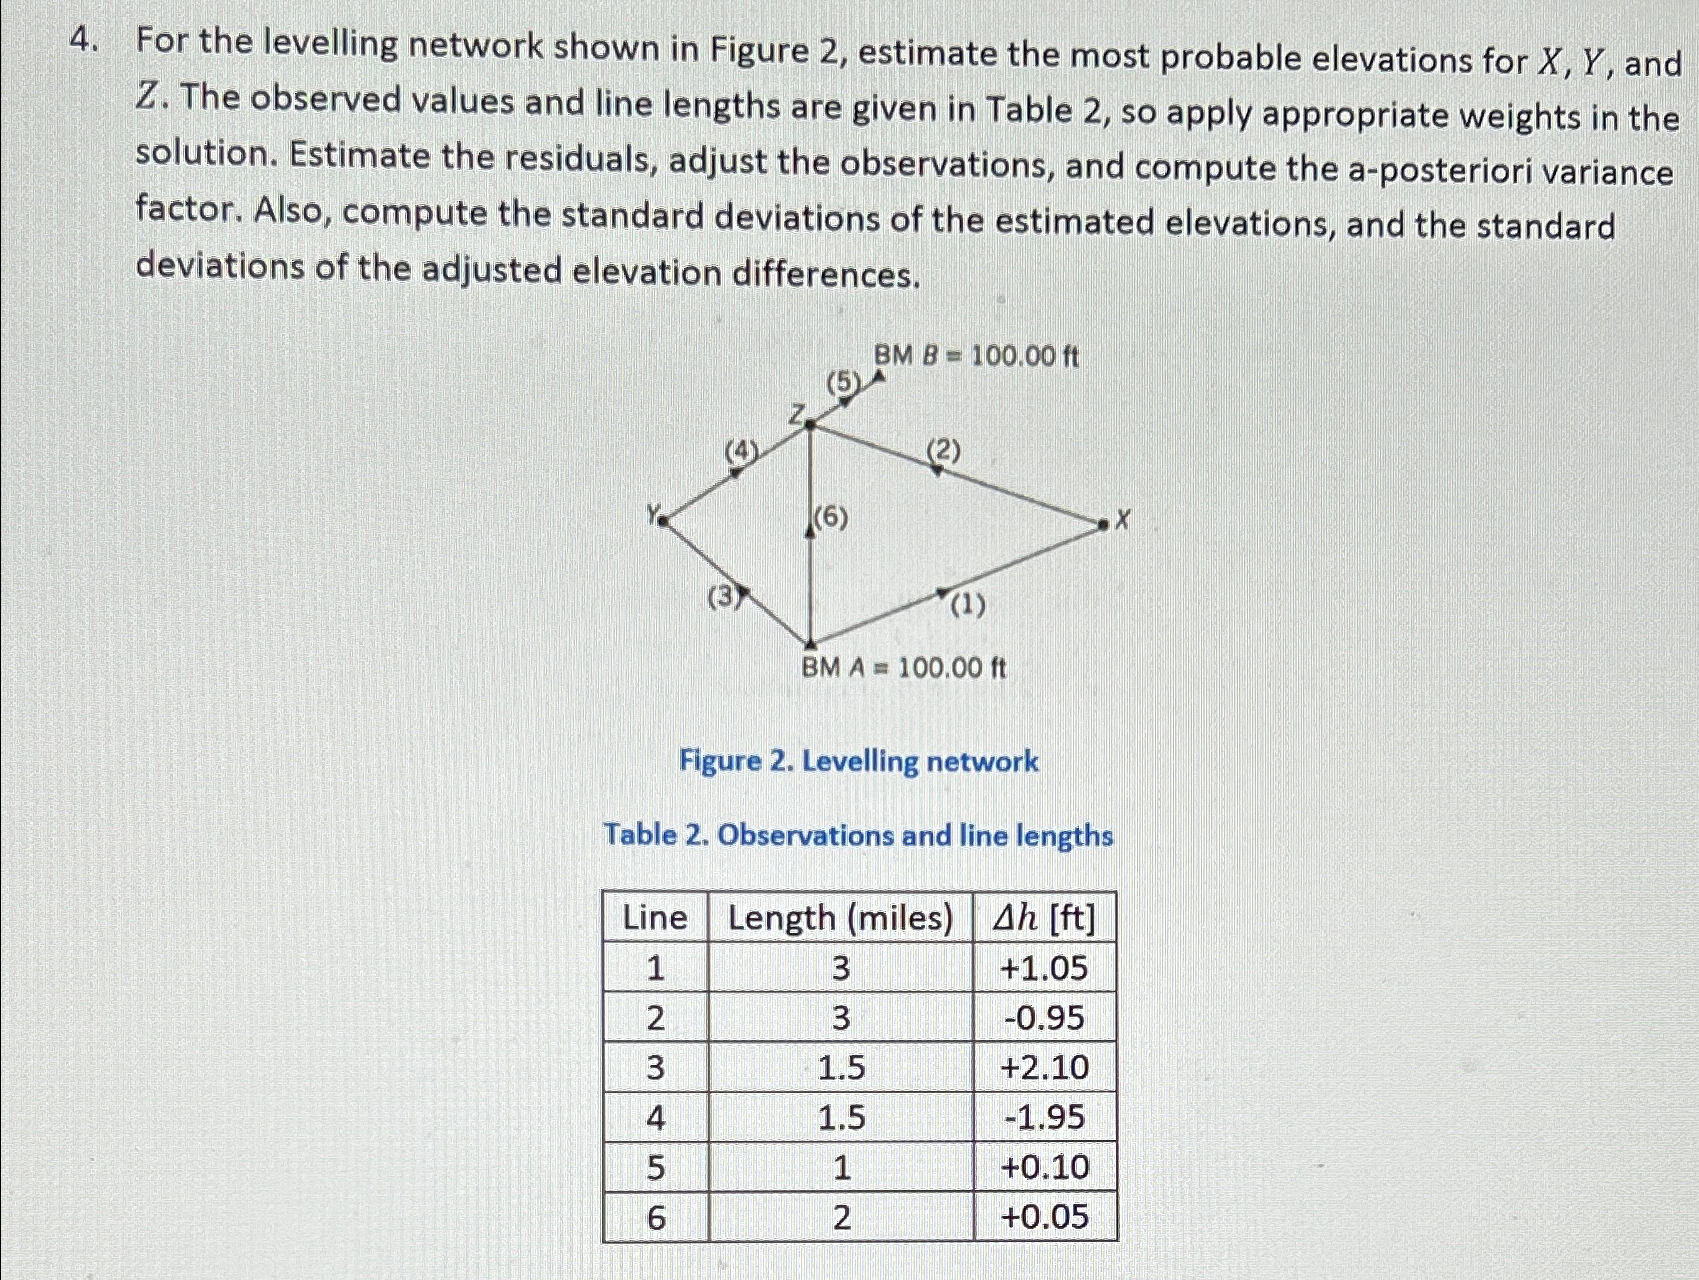
For the levelling network shown in Figure estimate the most probable elevations for and The observed values and line lengths are given in Table so apply appropriate weights in the solution. Estimate the residuals, adjust the observations, and compute the aposteriori variance factor. Also, compute the standard deviations of the estimated elevations, and the standard deviations of the adjusted elevation differences.
Figure Levelling network
Table Observations and line lengths
tableLineLength miles
Step by Step Solution
There are 3 Steps involved in it
1 Expert Approved Answer
Step: 1 Unlock

Question Has Been Solved by an Expert!
Get step-by-step solutions from verified subject matter experts
Step: 2 Unlock
Step: 3 Unlock