

Question: For the major league baseball data set, predict the number of wins (rounded up) for Washington by creating a multiple linear regression model for the
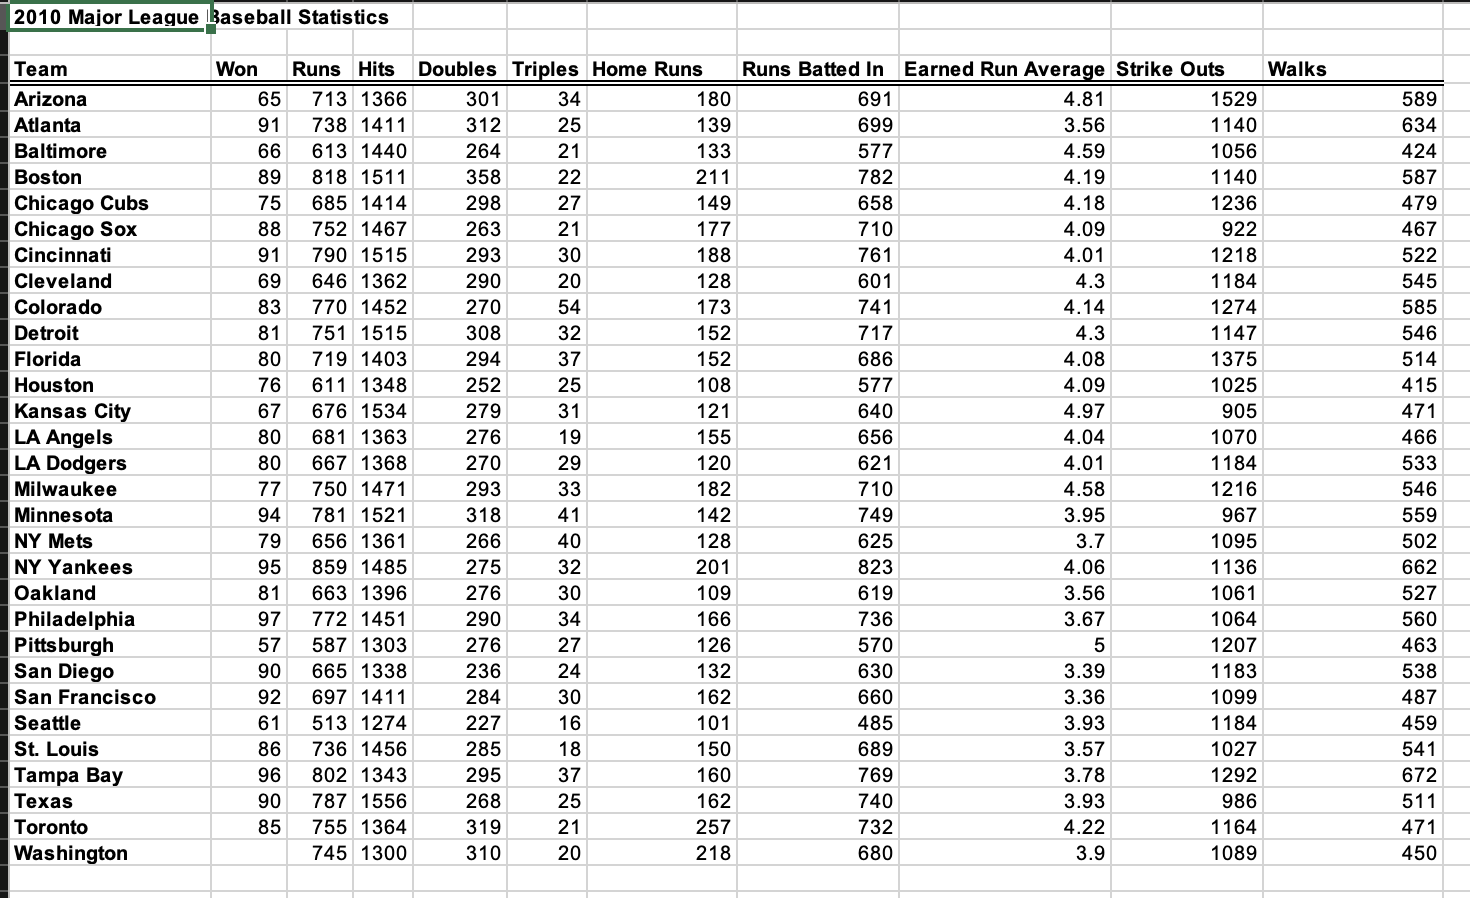
For the major league baseball data set, predict the number of wins (rounded up) for Washington by creating a multiple linear regression model for the data set (consider ALL independent variables without multicollinearity). Threshold for multicollinearity = 0.8 Won is the dependent variables and all other variables are Independent variables. (Ignore the Team column) For creation of correlation matrix and regression model, do not use the first column ("Team") and the last row. The last row consists of future data for independent variables which you will use to predict number of wins for Washington. Remember to have all independent variables adjacent to each other for the regression model. Select one: O a. 85 O b. 75 O c. 93 O d. 87 2010 Major League Baseball Statistics Team Won Runs Hits Doubles Triples Home Runs Runs Batted In Earned Run Average Strike Outs Walks Arizona 65 713 1366 301 34 180 691 Atlanta 4.81 1529 91 589 738 1411 312 25 139 699 3.56 Baltimore 1140 66 613 1440 634 264 21 133 577 4.59 Boston 1056 818 1511 424 89 358 22 211 782 4.19 Chicago Cubs 75 1140 685 1414 587 298 27 149 658 4.18 Chicago Sox 1236 88 479 752 1467 263 21 177 710 4.09 Cincinnati 922 91 790 1515 467 293 30 188 761 Cleveland 4.01 646 1362 1218 69 522 290 20 128 601 4.3 Colorado 1184 545 83 770 1452 270 54 173 741 4.14 Detroit 81 751 1515 1274 585 308 32 152 717 4.3 Florida 1147 80 719 1403 546 294 37 152 686 4.08 Houston 76 1375 611 1348 514 252 25 108 577 4.09 Kansas City 1025 67 676 1534 415 279 31 121 640 4.97 LA Angels 905 80 681 1363 471 276 19 155 656 4.04 LA Dodgers 1070 80 667 1368 466 270 29 120 621 4.01 Milwaukee 1184 77 750 1471 533 293 33 182 710 4.58 Minnesota 1216 94 781 1521 546 318 41 142 749 3.95 NY Mets 967 79 559 656 1361 266 40 128 625 3.7 NY Yankees 1095 95 859 1485 502 275 32 201 823 4.06 Oakland 1136 662 81 663 1396 276 30 109 619 Philadelphia 3.56 1061 97 772 1451 527 290 34 166 736 3.67 Pittsburgh 1064 57 560 587 1303 276 27 126 570 5 San Diego 90 665 1338 1207 463 236 24 132 630 3.39 San Francisco 1183 92 697 1411 538 284 30 162 660 3.36 Seattle 1099 61 487 513 1274 227 16 101 485 3.93 St. Louis 1184 86 736 1456 459 285 18 150 689 3.57 Tampa Bay 1027 96 541 802 1343 295 37 160 769 3.78 Texas 90 787 1556 1292 268 672 25 162 740 3.93 Toronto 986 85 755 1364 511 319 21 257 732 4.22 Washington 1164 471 745 1300 310 20 218 680 3.9 1089 450
Step by Step Solution
There are 3 Steps involved in it
To predict the number of wins for Washington using a multiple linear regression model lets follow these steps Step 1 Prepare the Data 1 Exclude the Team column and the last row of the dataset as instr... View full answer

Get step-by-step solutions from verified subject matter experts