

Question: For the North American segment only, estimate the average variable cost per unit using the high/low method. Use 2019 and 2020 as your two points
- For the North American segment only, estimate the average variable cost per unit using the high/low method. Use 2019 and 2020 as your two points for calculating the change in costs and change in units.
- For the North American segment only, estimate Fords fixed costs using the number of units sold, total automotive cost, and the variable cost per unit that you calculated in #8 above.
- For the North American segment only, what is Fords estimated contribution margin per unit sold in 2020? What does this number mean?
- In the North American segment only, estimate Fords break-even point in 2020?
- In the North American segment only, how many units did Ford sell above (below) its break-even point? How would you use this information to help management make decisions?
- What assumptions did you have to make in order to perform cost profit analysis using Fords financial statements?
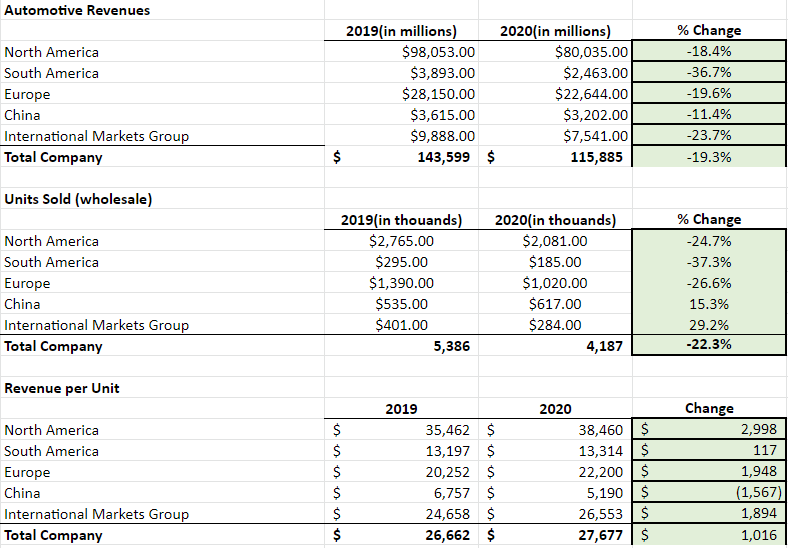
Automotive Revenues North America South America Europe China International Markets Group Total Company 2019(in millions) 2020(in millions) $98,053.00 $80,035.00 $3,893.00 $2,463.00 $28,150.00 $22,644.00 $3,615.00 $3,202.00 $9,888.00 $7,541.00 $ 143,599 $ 115,885 % Change -18.4% -36.7% -19.6% -11.4% -23.7% -19.3% $ Units Sold (wholesale) North America South America Europe China International Markets Group Total Company 2019(in thouands) $2,765.00 $295.00 $1,390.00 $535.00 $401.00 5,386 2020(in thouands) $2,081.00 $185.00 $1,020.00 $617.00 $284.00 4,187 % Change -24.7% -37.3% -26.6% 15.3% 29.2% -22.3% Revenue per Unit North America South America Europe China International Markets Group Total Company $ $ $ $ $ $ 2019 35,462 $ 13,197 $ 20,252 $ 6,757 $ 24,658 $ 26,662 $ 2020 38,460 $ 13,314 $ 22,200 $ 5,190 $ 26,553 $ 27,677 $ Change 2,998 117 1,948 (1,567) 1,894 1,016 Automotive Revenues North America South America Europe China International Markets Group Total Company 2019(in millions) 2020(in millions) $98,053.00 $80,035.00 $3,893.00 $2,463.00 $28,150.00 $22,644.00 $3,615.00 $3,202.00 $9,888.00 $7,541.00 $ 143,599 $ 115,885 % Change -18.4% -36.7% -19.6% -11.4% -23.7% -19.3% $ Units Sold (wholesale) North America South America Europe China International Markets Group Total Company 2019(in thouands) $2,765.00 $295.00 $1,390.00 $535.00 $401.00 5,386 2020(in thouands) $2,081.00 $185.00 $1,020.00 $617.00 $284.00 4,187 % Change -24.7% -37.3% -26.6% 15.3% 29.2% -22.3% Revenue per Unit North America South America Europe China International Markets Group Total Company $ $ $ $ $ $ 2019 35,462 $ 13,197 $ 20,252 $ 6,757 $ 24,658 $ 26,662 $ 2020 38,460 $ 13,314 $ 22,200 $ 5,190 $ 26,553 $ 27,677 $ Change 2,998 117 1,948 (1,567) 1,894 1,016
Step by Step Solution
There are 3 Steps involved in it

Get step-by-step solutions from verified subject matter experts