

Question: For the power delay profile shown in the figure below, P.(T) o dB -10 dB. -20 dB -30 dB 20 60 100 T(nano seconds)
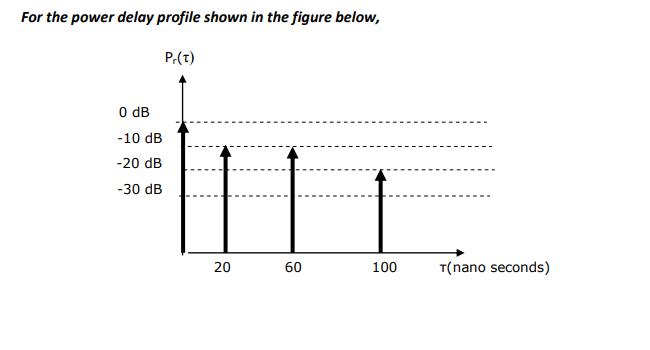


For the power delay profile shown in the figure below, P.(T) o dB -10 dB. -20 dB -30 dB 20 60 100 T(nano seconds) i. Calculate the mean excess delay ii. Calculate the delay spread iii. Calculate the 90% correlation coherence bandwidth iv. Given that an M-QAM modulation scheme would be adopted, determine the minimum value of M such that flat fading communication is achieved given that the required bit rate is 600 kbps. (For flat fading assume that 10 x signal bandwidth
Step by Step Solution
3.29 Rating (161 Votes )
There are 3 Steps involved in it
The detailed ... View full answer

Get step-by-step solutions from verified subject matter experts