

Question: For the scenario below, identify: a. the population, b. the sample, c. the parameter, d. the statistic, e. the variable, and f. the data.

![the parameter [Choose ] [Choose] the proportion of the sample who thinks](https://s3.amazonaws.com/si.experts.images/answers/2024/05/66481b99d36ef_68966481b99bcd5f.jpg)
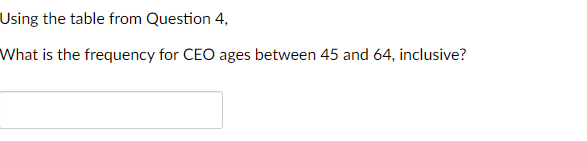

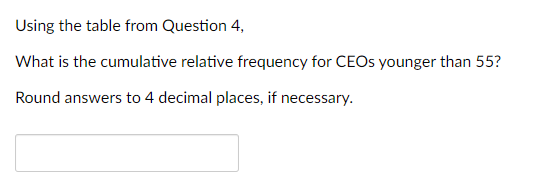
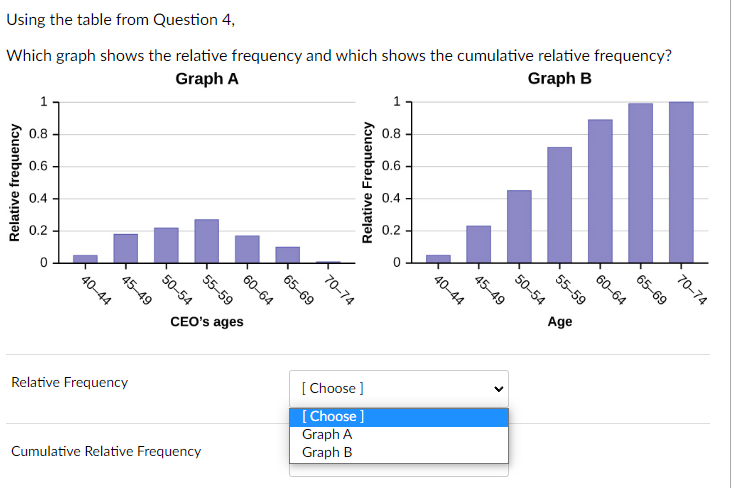
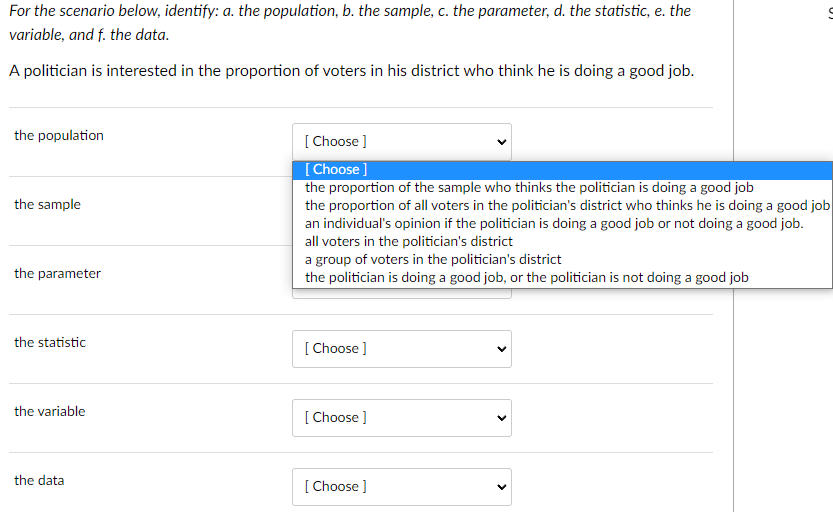
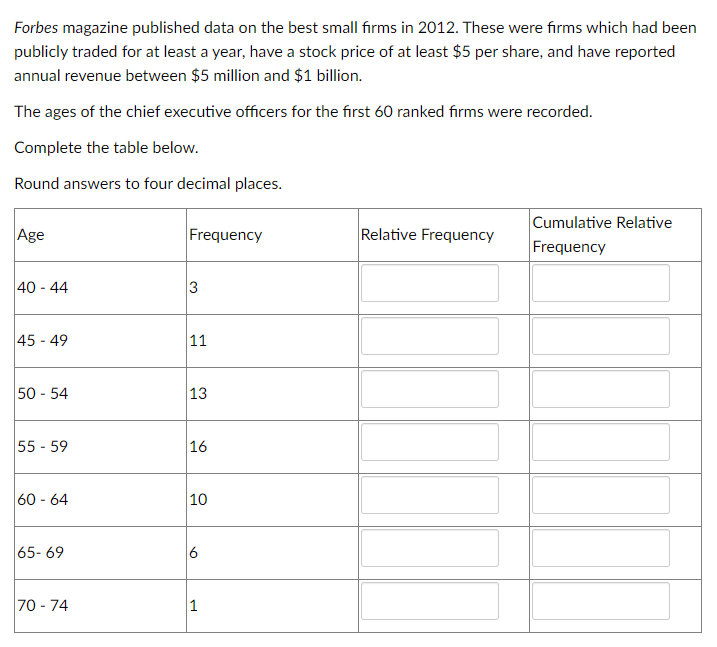
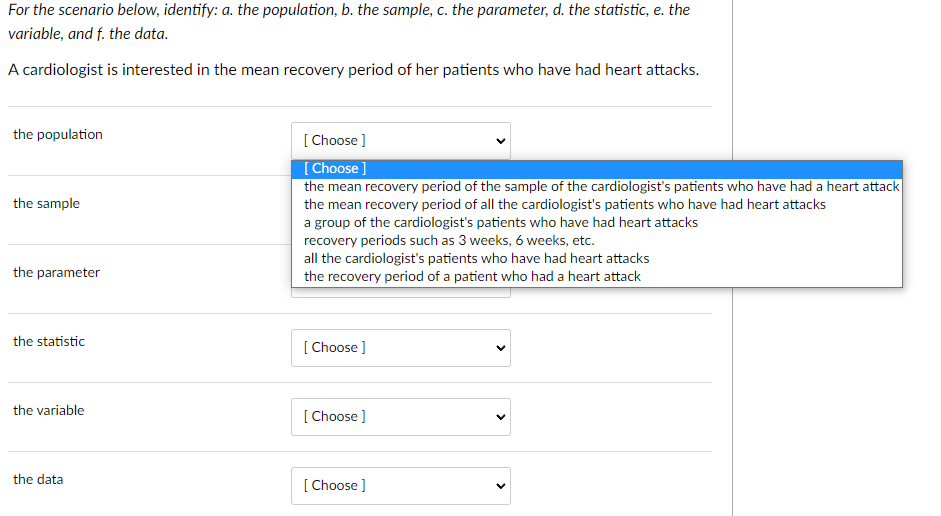
For the scenario below, identify: a. the population, b. the sample, c. the parameter, d. the statistic, e. the variable, and f. the data. A politician is interested in the proportion of voters in his district who think he is doing a good job. the population the sample the parameter [Choose ] [Choose] the proportion of the sample who thinks the politician is doing a good job the proportion of all voters in the politician's district who thinks he is doing a good job an individual's opinion if the politician is doing a good job or not doing a good job. all voters in the politician's district a group of voters in the politician's district the politician is doing a good job, or the politician is not doing a good job the statistic [Choose ] the variable [Choose ] the data [Choose ] Forbes magazine published data on the best small firms in 2012. These were firms which had been publicly traded for at least a year, have a stock price of at least $5 per share, and have reported annual revenue between $5 million and $1 billion. The ages of the chief executive officers for the first 60 ranked firms were recorded. Complete the table below. Round answers to four decimal places. Age Frequency 40-44 3 45-49 11 50-54 13 55-59 16 60-64 10 65-69 6 70-74 1 Cumulative Relative Relative Frequency Frequency For the scenario below, identify: a. the population, b. the sample, c. the parameter, d. the statistic, e. the variable, and f. the data. A cardiologist is interested in the mean recovery period of her patients who have had heart attacks. the population the sample the parameter [Choose ] [Choose] the mean recovery period of the sample of the cardiologist's patients who have had a heart attack the mean recovery period of all the cardiologist's patients who have had heart attacks a group of the cardiologist's patients who have had heart attacks recovery periods such as 3 weeks, 6 weeks, etc. all the cardiologist's patients who have had heart attacks the recovery period of a patient who had a heart attack the statistic [Choose ] the variable [Choose ] the data [Choose ] How many classes are there in the frequency distribution from Question 4? What is the class width of the classes in the frequency distribution is Question 4. Using the table from Question 4, What is the frequency for CEO ages between 45 and 64, inclusive? Using the table from Question 4, What is the relative frequency of ages under 50? Round answers to four decimal places. Using the table from Question 4, What is the cumulative relative frequency for CEOs younger than 55? Round answers to 4 decimal places, if necessary. Using the table from Question 4, Which graph shows the relative frequency and which shows the cumulative relative frequency? Relative frequency 1 0.8 0.6 0.4- 0.2- Graph A Relative Frequency 70-74 65-69 60-64 55-59 50-54 45-49 CEO's ages 40-44 Relative Frequency Cumulative Relative Frequency - 0.8 0.6 0.4 0.2- [Choose ] [Choose] Graph A Graph B Graph B 70-74 65-69 60-64 55-59 50-54 Age 45-49 40-44
Step by Step Solution
There are 3 Steps involved in it

Get step-by-step solutions from verified subject matter experts