

Question: For the single - server queue problem of Section 2 . 1 . 1 in the Kelton replace the data in Table 2 - 1
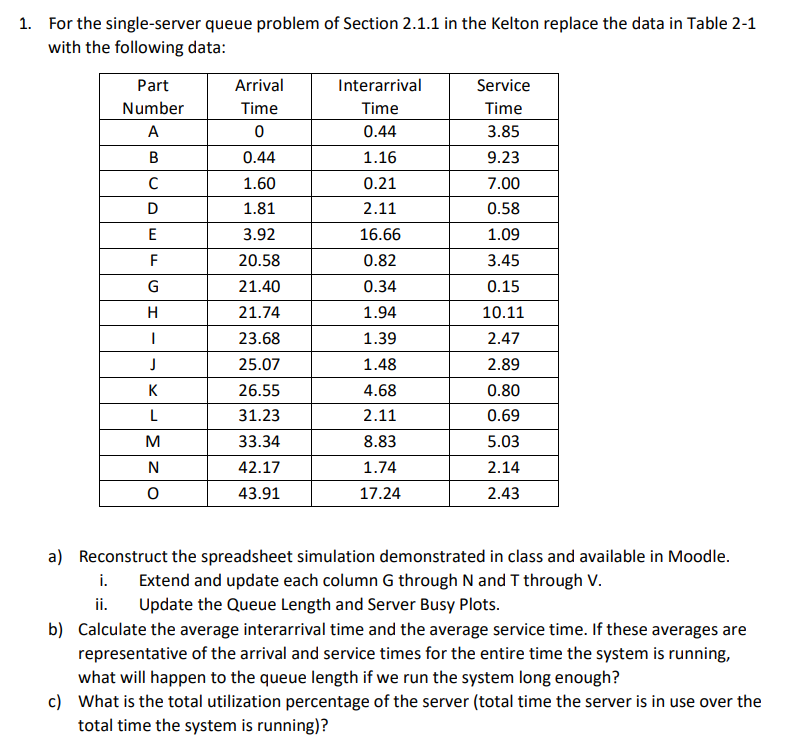
For the singleserver queue problem of Section in the Kelton replace the data in Table with the following data:
tabletablePartNumbertableArrivalTimetableInterarrivalTimetableServiceTimeABCDEFGHIJKLMNO
a Reconstruct the spreadsheet simulation demonstrated in class and available in Moodle.
i Extend and update each column through and through
ii Update the Queue Length and Server Busy Plots.
b Calculate the average interarrival time and the average service time. If these averages are representative of the arrival and service times for the entire time the system is running, what will happen to the queue length if we run the system long enough?
c What is the total utilization percentage of the server total time the server is in use over the total time the system is running
Step by Step Solution
There are 3 Steps involved in it
1 Expert Approved Answer
Step: 1 Unlock

Question Has Been Solved by an Expert!
Get step-by-step solutions from verified subject matter experts
Step: 2 Unlock
Step: 3 Unlock