

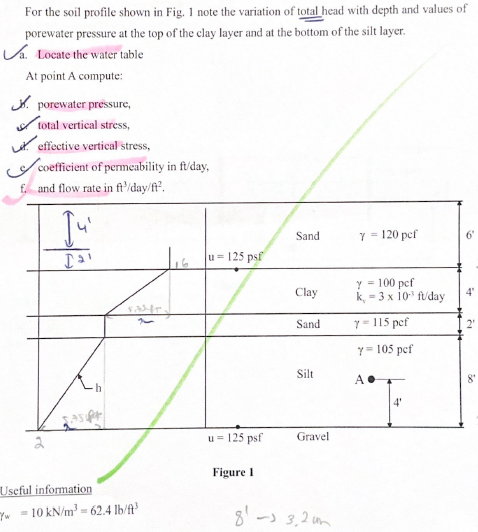
Question: For the soil profile shown in Fig. 1 note the variation of total head with depth and values of porewater pressure at the top of
For the soil profile shown in Fig. note the variation of total head with depth and values of porewater pressure at the top of the clay layer and at the bottom of the silt layer.
a Locate the water table
At point A compute:
porewater pressure,
c total vertical stress,
effective vertical stress,
c coefficient of permeability in ftday
f and flow rate in day
Figure
Useful information
Step by Step Solution
There are 3 Steps involved in it
1 Expert Approved Answer
Step: 1 Unlock

Question Has Been Solved by an Expert!
Get step-by-step solutions from verified subject matter experts
Step: 2 Unlock
Step: 3 Unlock