

Question: For the two SKUs identified above: a. For a 95% service rate, what is the total safety stock inventory for each SKU under the decentralized
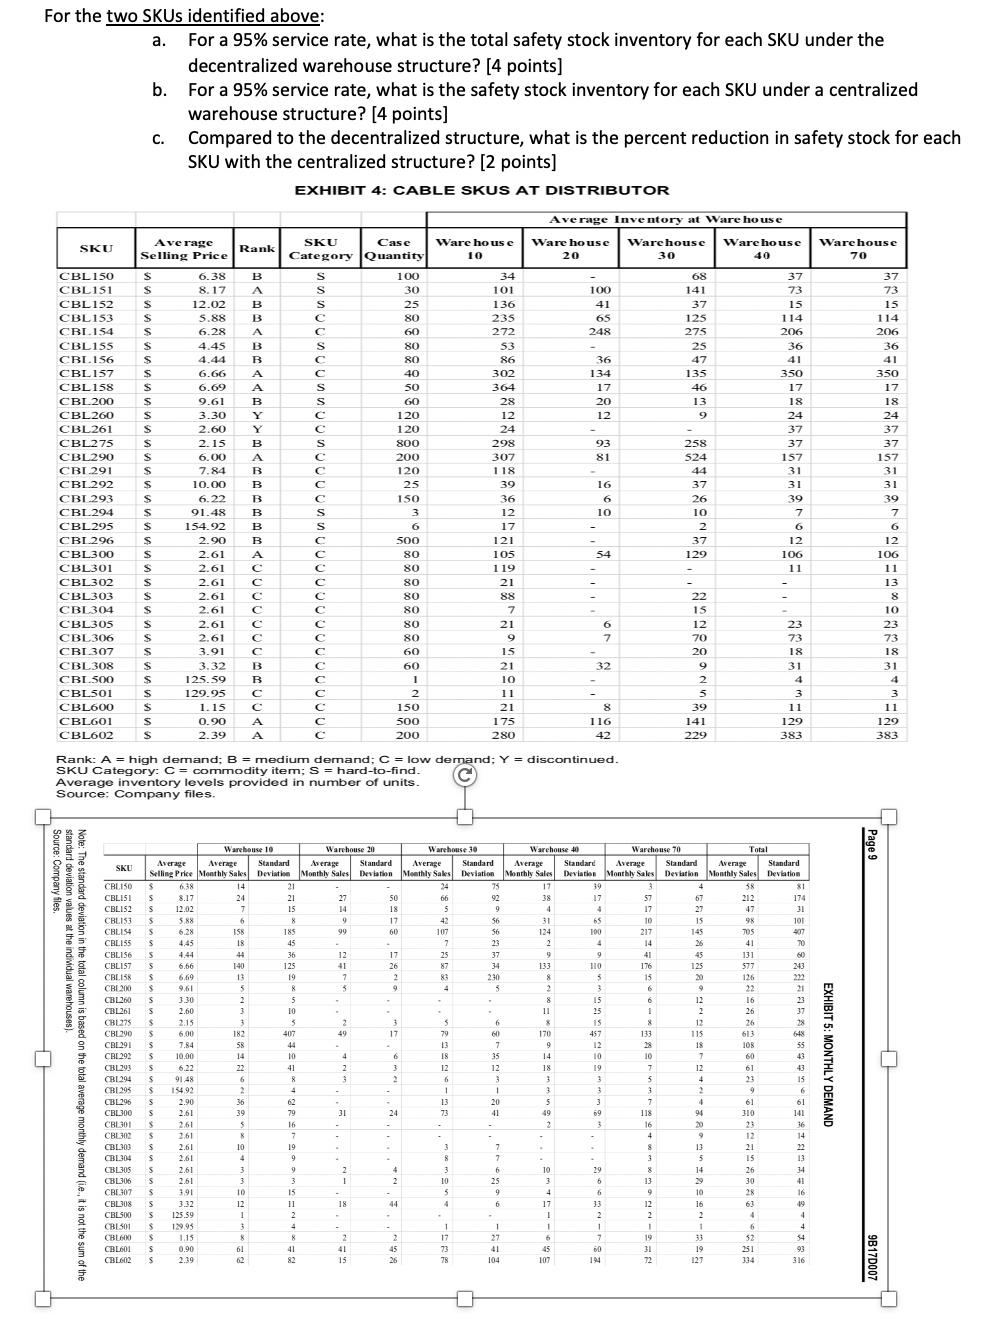
For the two SKUs identified above: a. For a 95% service rate, what is the total safety stock inventory for each SKU under the decentralized warehouse structure? [4 points) b. For a 95% service rate, what is the safety stock inventory for each SKU under a centralized warehouse structure? (4 points] Compared to the decentralized structure, what is the percent reduction in safety stock for each SKU with the centralized structure? (2 points) EXHIBIT 4: CABLE SKUS AT DISTRIBUTOR C. Average Inventory at Warehouse SKU Rank Warehouse 10 Warehouse 20 Warehouse 30 Warehouse 40 Warehouse 70 B SKU Case Category Quantity S 100 S 30 S 25 80 C 60 B 100 41 65 248 S - 80 80 68 141 37 125 275 25 47 135 46 13 9 S S 40 SO 134 17 20 12 A B B A B Y Y B A B B B B B C C S C CBL 150 CBL151 CBL 152 CBL153 CBL 154 CBL155 CBL1.56 CBL157 CBL 158 CBL 200 CBL 260 CBL 261 CBL275 CBL290 CBL 291 CBL 292 CBL 293 CBL 294 CBL 295 CBL 296 CBL300 CBL301 CBL302 CBL303 CBL304 CBL305 CBL 306 CBL 307 CBL 308 CBL500 CBL501 CBL600 CBL601 CBL602 Average Selling Price $ 6.38 $ 8.17 $ 12.02 S 5.88 $ 6.28 $ 4.45 $ 4.44 S 6.66 $ 6.69 $ 9.61 $ 3.30 $ 2.60 $ 2.15 $ 6.00 S 7.84 $ 10.00 $ 6.22 $ 91.48 $ 154.92 $ 2.90 $ 2.61 $ 2.61 $ 2.61 $ 2.61 $ 2.61 S 2.61 S 2.61 $ 3.91 S 3.32 $ 125.59 $ 129.95 $ 1.15 $ 0.90 $ 239 93 81 258 524 37 73 15 114 206 36 41 350 17 18 24 37 37 157 31 31 39 7 37 73 15 114 206 36 41 350 17 18 24 37 37 157 31 31 39 7 6 12 106 11 34 101 136 235 272 53 86 302 364 28 12 24 298 307 118 39 36 12 17 121 105 119 21 88 7 21 9 IS 21 10 11 21 175 280 ==% 2B%977876gw1. GO 120 120 800 200 120 25 150 3 6 500 80 80 80 80 80 80 80 60 16 6 10 37 26 10 37 129 54 C S S c C C C C C 22 C C 6 12 106 11 13 8 10 23 73 18 31 4 3 15 12 70 20 9 2. 6 7 23 73 18 31 60 32 - B C . A 1 2 150 500 200 3 11 8 116 42 5 39 141 229 129 383 11 129 383 Rank: A = high demand; B = medium demand; C = low demand; Y = discontinued. SKU Category: C = commodity item; S = hard-to-find. Average inventory levels provided in number of units. Source: Company files. Page 9 SKU & standard deviation values at the individual warehouses) The standard deviation in the total column is based on the total average mo Warehouse 10 Warehouse 20 Warehouse 30 Warehouse 40 Warehouse 70 Total Average Average Standard Average Standard Average Standard Average Standard Average Standard Average Standard Selling Price Monthly Sales Deviation Monthly Sales Deviation Monthly Sales Deviation Monthly Sales Deviation Monthly Sales Deviation Monthly Sales Deviation S 6.38 14 21 24 75 17 19 3 4 38 81 s 8.17 24 21 27 50 66 92 38 17 57 67 212 174 S 12.02 7 15 14 18 5 9 4 4 17 27 47 31 s 5.88 6 8 9 9 17 56 31 65 10 15 98 101 S $ 6.28 158 185 99 60 107 56 124 100 217 145 705 207 S 4.45 18 45 7 23 2 4 14 26 4. 70 s 4.44 44 36 12 17 25 37 9 9 41 45 131 60 s 6.66 140 125 41 26 87 34 133 110 176 125 243 S 6.69 13 19 7 2 83 230 8 5 15 20 126 222 S. 9.61 5 8 5 9 4 5 2 3 6 9 22 21 s 3.30 2 5 8 15 6 12 16 23 S 2.60 3 10 11 25 1 2 26 37 S 2.15 S 2 S 6 15 8 12 26 28 S 6,00 182 407 17 79 60 60 170 457 133 115 613 S 7.84 58 44 13 7 9 12 29 IS IOS 55 S 10.00 14 10 4 6 6 18 35 14 10 10 7 60 43 s 6.22 22 41 2 12 12 18 19 7 61 43 S 91.48 6 8 3 2 6 3 3 3 3 4 23 15 S 154.92 2 4 - 1 i 1 3 3 3 9 6 s 2.90 36 62 13 20 5 3 3 7 4 61 S 61 2.61 39 79 31 24 73 41 49 69 118 91 310 141 S 2.61 5 16 - 2 2 3 16 20 23 16 S 2.61 8 7 - 4 4 9 12 14 2.61 10 19 - 3 7 S 13 21 s 2.61 4 9 9 7 3 5 15 13 S 2.61 3 2 2 4 3 6 10 29 14 26 34 S 2.61 3 1 2 10 25 3 6 13 29 30 41 s 3.91 10 IS - 5 9 4 6 9 10 16 s 12 11 18 44 4 6 6 17 33 12 16 19 125.59 1 2 1 1 2 2 2 4 4 $ 1995 3 4 - 1 1 1 1 1 6 4 S 1.15 8 8 2 2 17 27 6 7 19 33 52 $4 s 0.90 61 41 45 73 45 60 31 19 251 93 S 2.39 82 15 26 78 104 107 194 127 334 316 CRLISO CBLISI CBL152 CBLIS3 CBL154 CBLISS CBL156 CBLIS7 CBL158 CBL200 CBL260 CBL261 CBL275 CBL 290 CBL291 CRI292 CB293 CBI 294 CBL 295 CBL296 CBL300 CRL 301 CBL302 CBL 303 CBL304 CBL305 CB306 CBL 307 CBL 308 CBL500 CBL 501 CBL600 CBL601 CBL602 EXHIBIT 5: MONTHLY DEMAND ot the sum of the 9B17D007 For the two SKUs identified above: a. For a 95% service rate, what is the total safety stock inventory for each SKU under the decentralized warehouse structure? [4 points) b. For a 95% service rate, what is the safety stock inventory for each SKU under a centralized warehouse structure? (4 points] Compared to the decentralized structure, what is the percent reduction in safety stock for each SKU with the centralized structure? (2 points) EXHIBIT 4: CABLE SKUS AT DISTRIBUTOR C. Average Inventory at Warehouse SKU Rank Warehouse 10 Warehouse 20 Warehouse 30 Warehouse 40 Warehouse 70 B SKU Case Category Quantity S 100 S 30 S 25 80 C 60 B 100 41 65 248 S - 80 80 68 141 37 125 275 25 47 135 46 13 9 S S 40 SO 134 17 20 12 A B B A B Y Y B A B B B B B C C S C CBL 150 CBL151 CBL 152 CBL153 CBL 154 CBL155 CBL1.56 CBL157 CBL 158 CBL 200 CBL 260 CBL 261 CBL275 CBL290 CBL 291 CBL 292 CBL 293 CBL 294 CBL 295 CBL 296 CBL300 CBL301 CBL302 CBL303 CBL304 CBL305 CBL 306 CBL 307 CBL 308 CBL500 CBL501 CBL600 CBL601 CBL602 Average Selling Price $ 6.38 $ 8.17 $ 12.02 S 5.88 $ 6.28 $ 4.45 $ 4.44 S 6.66 $ 6.69 $ 9.61 $ 3.30 $ 2.60 $ 2.15 $ 6.00 S 7.84 $ 10.00 $ 6.22 $ 91.48 $ 154.92 $ 2.90 $ 2.61 $ 2.61 $ 2.61 $ 2.61 $ 2.61 S 2.61 S 2.61 $ 3.91 S 3.32 $ 125.59 $ 129.95 $ 1.15 $ 0.90 $ 239 93 81 258 524 37 73 15 114 206 36 41 350 17 18 24 37 37 157 31 31 39 7 37 73 15 114 206 36 41 350 17 18 24 37 37 157 31 31 39 7 6 12 106 11 34 101 136 235 272 53 86 302 364 28 12 24 298 307 118 39 36 12 17 121 105 119 21 88 7 21 9 IS 21 10 11 21 175 280 ==% 2B%977876gw1. GO 120 120 800 200 120 25 150 3 6 500 80 80 80 80 80 80 80 60 16 6 10 37 26 10 37 129 54 C S S c C C C C C 22 C C 6 12 106 11 13 8 10 23 73 18 31 4 3 15 12 70 20 9 2. 6 7 23 73 18 31 60 32 - B C . A 1 2 150 500 200 3 11 8 116 42 5 39 141 229 129 383 11 129 383 Rank: A = high demand; B = medium demand; C = low demand; Y = discontinued. SKU Category: C = commodity item; S = hard-to-find. Average inventory levels provided in number of units. Source: Company files. Page 9 SKU & standard deviation values at the individual warehouses) The standard deviation in the total column is based on the total average mo Warehouse 10 Warehouse 20 Warehouse 30 Warehouse 40 Warehouse 70 Total Average Average Standard Average Standard Average Standard Average Standard Average Standard Average Standard Selling Price Monthly Sales Deviation Monthly Sales Deviation Monthly Sales Deviation Monthly Sales Deviation Monthly Sales Deviation Monthly Sales Deviation S 6.38 14 21 24 75 17 19 3 4 38 81 s 8.17 24 21 27 50 66 92 38 17 57 67 212 174 S 12.02 7 15 14 18 5 9 4 4 17 27 47 31 s 5.88 6 8 9 9 17 56 31 65 10 15 98 101 S $ 6.28 158 185 99 60 107 56 124 100 217 145 705 207 S 4.45 18 45 7 23 2 4 14 26 4. 70 s 4.44 44 36 12 17 25 37 9 9 41 45 131 60 s 6.66 140 125 41 26 87 34 133 110 176 125 243 S 6.69 13 19 7 2 83 230 8 5 15 20 126 222 S. 9.61 5 8 5 9 4 5 2 3 6 9 22 21 s 3.30 2 5 8 15 6 12 16 23 S 2.60 3 10 11 25 1 2 26 37 S 2.15 S 2 S 6 15 8 12 26 28 S 6,00 182 407 17 79 60 60 170 457 133 115 613 S 7.84 58 44 13 7 9 12 29 IS IOS 55 S 10.00 14 10 4 6 6 18 35 14 10 10 7 60 43 s 6.22 22 41 2 12 12 18 19 7 61 43 S 91.48 6 8 3 2 6 3 3 3 3 4 23 15 S 154.92 2 4 - 1 i 1 3 3 3 9 6 s 2.90 36 62 13 20 5 3 3 7 4 61 S 61 2.61 39 79 31 24 73 41 49 69 118 91 310 141 S 2.61 5 16 - 2 2 3 16 20 23 16 S 2.61 8 7 - 4 4 9 12 14 2.61 10 19 - 3 7 S 13 21 s 2.61 4 9 9 7 3 5 15 13 S 2.61 3 2 2 4 3 6 10 29 14 26 34 S 2.61 3 1 2 10 25 3 6 13 29 30 41 s 3.91 10 IS - 5 9 4 6 9 10 16 s 12 11 18 44 4 6 6 17 33 12 16 19 125.59 1 2 1 1 2 2 2 4 4 $ 1995 3 4 - 1 1 1 1 1 6 4 S 1.15 8 8 2 2 17 27 6 7 19 33 52 $4 s 0.90 61 41 45 73 45 60 31 19 251 93 S 2.39 82 15 26 78 104 107 194 127 334 316 CRLISO CBLISI CBL152 CBLIS3 CBL154 CBLISS CBL156 CBLIS7 CBL158 CBL200 CBL260 CBL261 CBL275 CBL 290 CBL291 CRI292 CB293 CBI 294 CBL 295 CBL296 CBL300 CRL 301 CBL302 CBL 303 CBL304 CBL305 CB306 CBL 307 CBL 308 CBL500 CBL 501 CBL600 CBL601 CBL602 EXHIBIT 5: MONTHLY DEMAND ot the sum of the 9B17D007
Step by Step Solution
There are 3 Steps involved in it

Get step-by-step solutions from verified subject matter experts