

Question: For the well deliverability test (data given below), with the help of a spreadsheet, a. Find and plot the IPR using JBG and Fetkovich models.
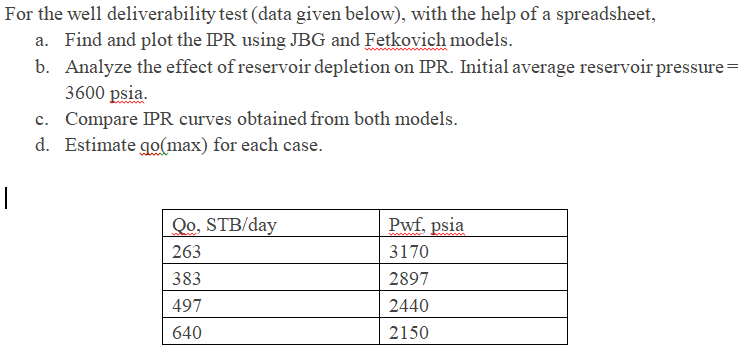
For the well deliverability test (data given below), with the help of a spreadsheet, a. Find and plot the IPR using JBG and Fetkovich models. b. Analyze the effect of reservoir depletion on IPR. Initial average reservoir pressure 3600 psia. c. Compare IPR curves obtained from both models. d. Estimate go(max) for each case. Qo, STB/day 263 383 497 640 Pwf, psia 3170 2897 2440 2150 For the well deliverability test (data given below), with the help of a spreadsheet, a. Find and plot the IPR using JBG and Fetkovich models. b. Analyze the effect of reservoir depletion on IPR. Initial average reservoir pressure 3600 psia. c. Compare IPR curves obtained from both models. d. Estimate go(max) for each case. Qo, STB/day 263 383 497 640 Pwf, psia 3170 2897 2440 2150
Step by Step Solution
There are 3 Steps involved in it

Get step-by-step solutions from verified subject matter experts