

Question: For the x values [0.7 1.45 2 3 3 .5 4 5. 5 6.3], and the y values [0.35 3 8 26 43 74 125
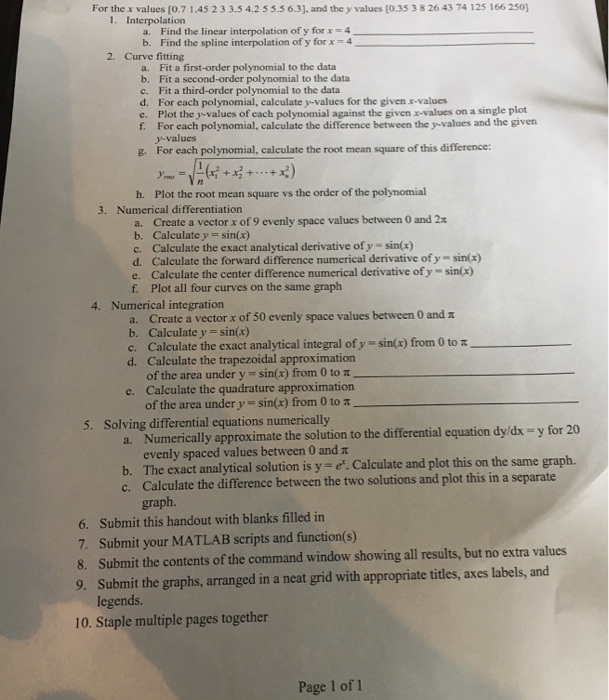
For the x values [0.7 1.45 2 3 3 .5 4 5. 5 6.3], and the y values [0.35 3 8 26 43 74 125 166 250] Interpolation a. Find the linear interpolation of y for x = 4 ____ b. Find the spline interpolation of y for x = 4 ____ Curve fitting a. Fit a first-order polynomial to the data b. Fit a second-order polynomial to the data c. Fit a third-order polynomial to the data d. For each polynomial, calculate y-values for the given x-values e. Plot the y-values of each polynomial against the given x-values on a single plot f. For each polynomial, calculate the difference between the y-values and the given y-values. g. For each polynomial, calculate the root mean square of this difference: y_max = Squareroot 1 (x_1^2 + x_2^2 + .... + x_n^2) h. Plot the root mean square vs the order of the polynomial Numerical differentiation a. Create a vector x of 9 evenly space values between 0 and 2 pi b. Calculate y = sin(x) c. Calculate the exact analytical derivative of y = sin(x) d. Calculate the forward difference numerical derivative of y = sin (x) e. Calculate the center difference numerical derivative of y - sin(x) f. Plot all four curves on the same graph Numerical integration a. Create a vector x of 50 evenly space values between 0 and pi b. Calculate v = sin(x) c. Calculate the exact analytical integral of = sin(x) from 0 to pi _____ d. Calculate the trapezoidal approximation of the area under y = sin(x) from 0 to x _____ c. Calculate the quadrature approximation of the area under y = sin(x) from 0 to pi ______ Solving differential equations numerically a. Numerically approximate the solution to the differential equation dy/dx = y for 20 evenly spaced values between 0 and pi b. The exact analytical solution is y = e^x. Calculate and plot this on the same graph. c. Calculate the difference between the two solutions and plot this in a separate graph. Submit this handout with blanks filled in Submit your MATLAB scripts and function(s) Submit tin: contents of the command window showing all results, but no extra values Submit the graphs, arranged in a neat grid with appropriate tides, axes labels, and legends. Staple multiple pages together
Step by Step Solution
There are 3 Steps involved in it

Get step-by-step solutions from verified subject matter experts