

Question: For the Yield Curve tab, 1. Plot a yield curve for each year between 2006 - 2020 and display on one graph. 2.Indicate the shape
For the Yield Curve tab,
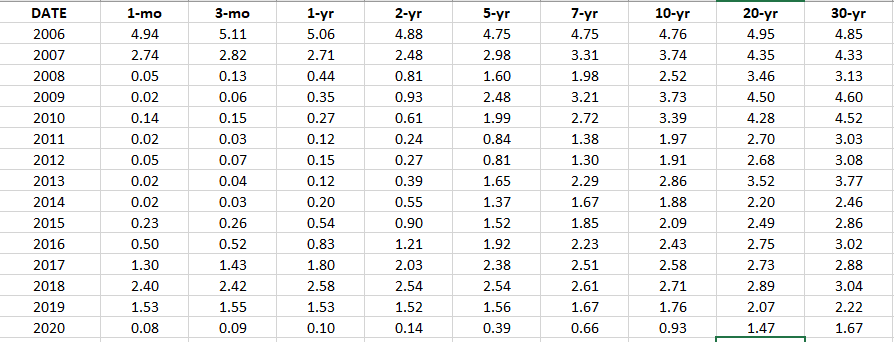
1. Plot a yield curve for each year between 2006 - 2020 and display on one graph.
2.Indicate the shape of the yield curve for each year, i.e., Normal, Inverted, or Flat.
It will not let me upload an excel sheet, please use th
Step by Step Solution
There are 3 Steps involved in it
1 Expert Approved Answer
Step: 1 Unlock

Question Has Been Solved by an Expert!
Get step-by-step solutions from verified subject matter experts
Step: 2 Unlock
Step: 3 Unlock