

Question: For theWeek 8 Critical Thinking Exercise, youwillreview trade balances using the Economist publication (see graphic below) for major global economics for at least four countries
For theWeek 8 Critical Thinking Exercise, youwillreview trade balances using the Economist publication (see graphic below) for major global economics for at least four countries and discuss the following data items below relative to trends observed and any reasons you believe this is occurring based on research of these economies and their characteristics relative to production and consumption trends.
- Trade Balance
- Current Account Balance
- Currency Units per US Dollar
- Interest Rates
- Budget Balance
The submission should include a detailed written response reporting on trade policies and areas of comparative advantage in production.
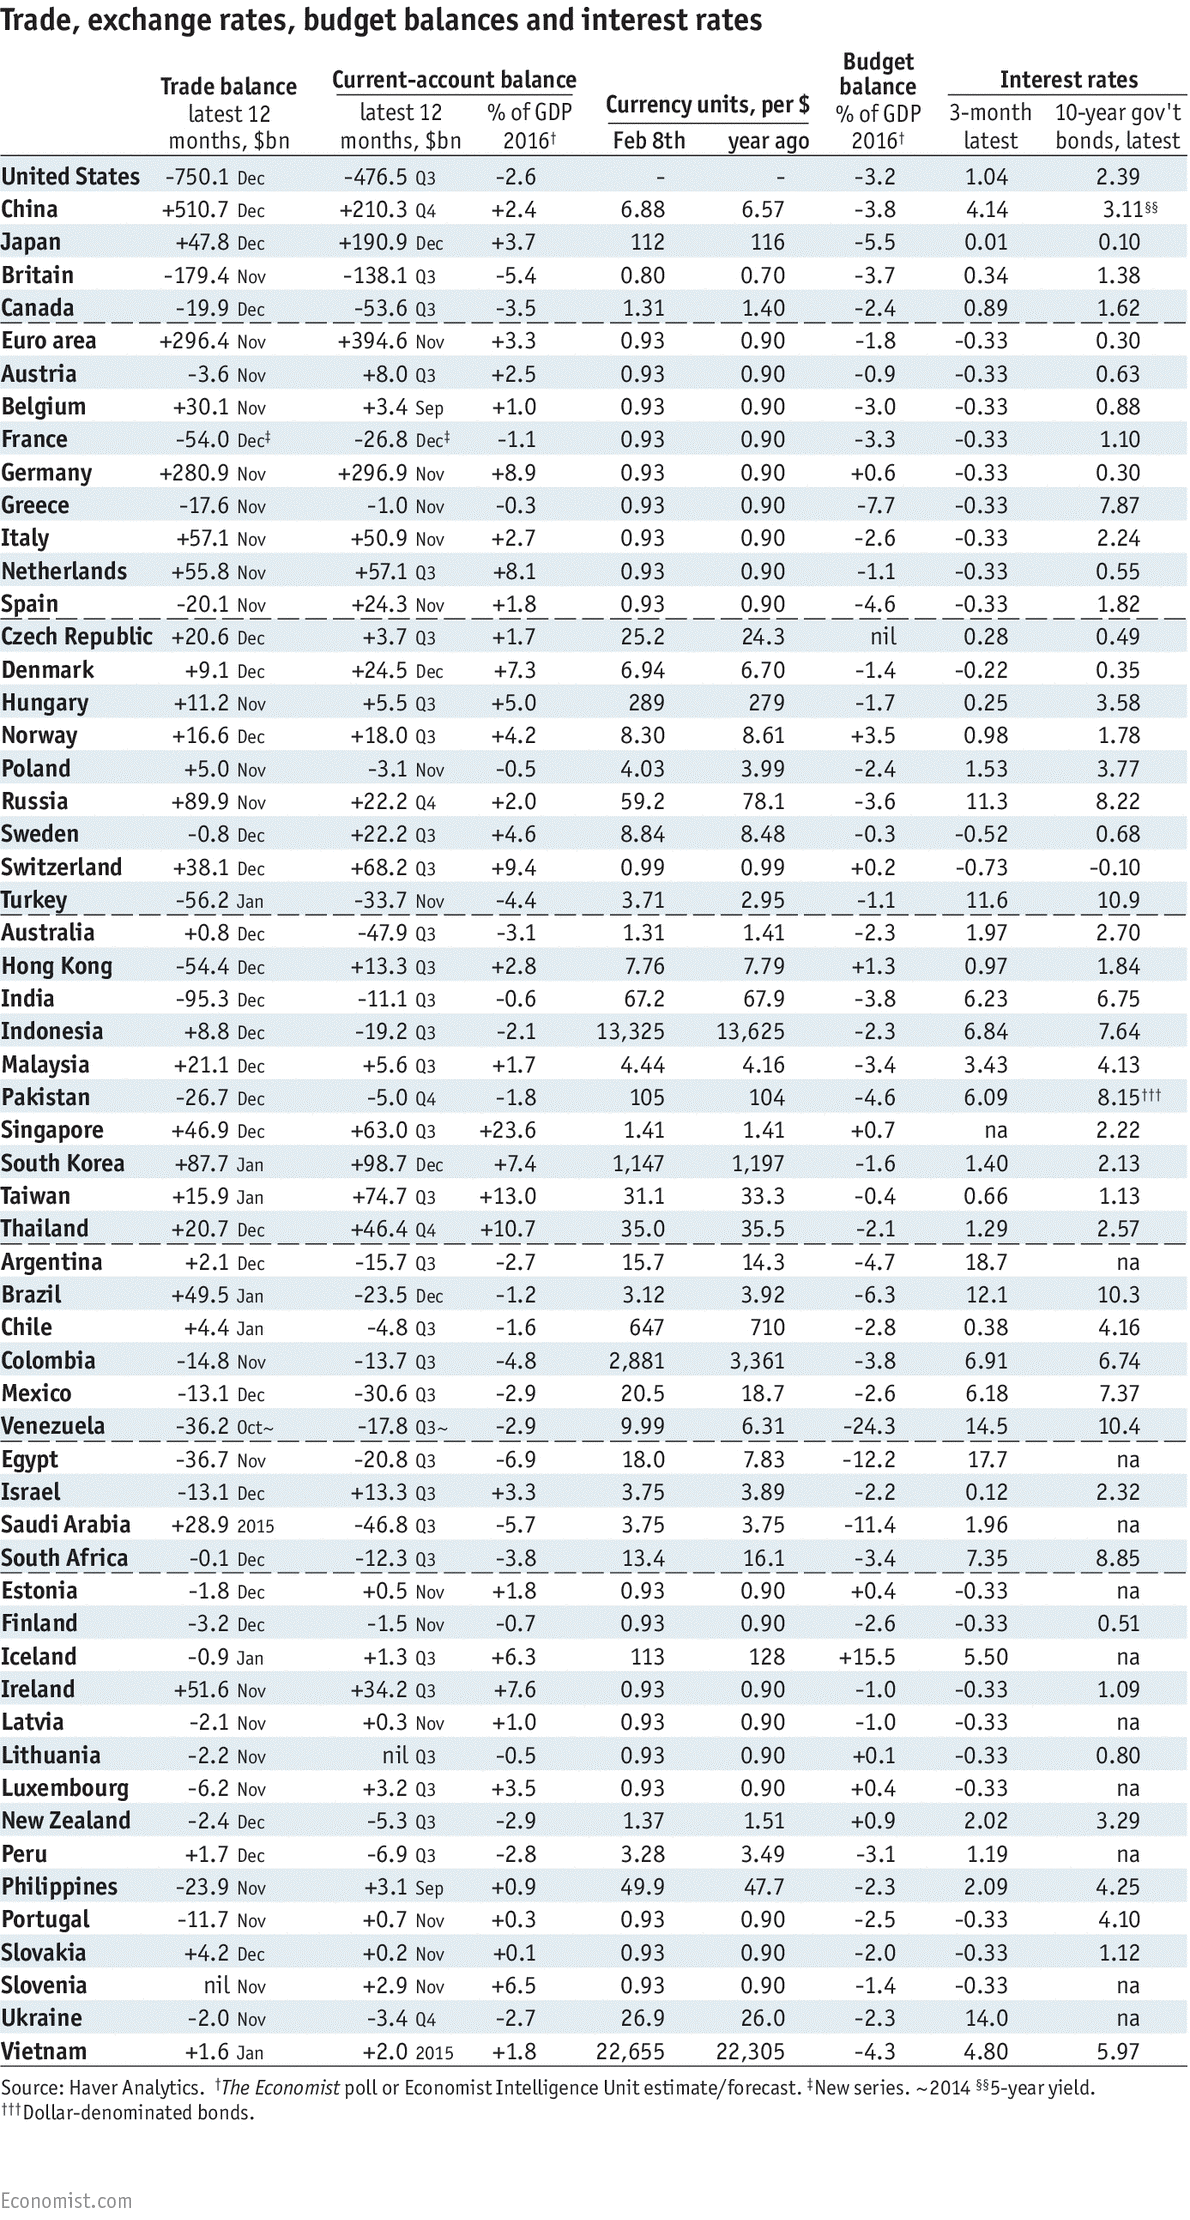
Trade, exchange rates, budget balances and interest rates Trade balance Current-account balance Budget Interest rates latest 12 latest 12 Currency units, per $ months, $bn months, $bn Feb 8th year ago 2016t latest bonds, latest -476.5 Q3 -2.6 -3.2 2.39 China +210.3 04 +2.4 6.88 -3.8 Japan +47.8 Dec 112 116 -5.5 0.01 Britain -179.4 Nov -138.1 Q3 0.80 0.70 -3.7 0.34 Canada -2.4 Euro area +394.6 Nov 0.90 -1.8 Austria -3.6 Nov +8.0 Q3 0.90 -0.9 -0.33 0.63 Belgium +3.4 Sep 0.90 -0.33 -54.0 Dect -26.8 Dec 1.1 .90 -0.33 1.10 Germany +296.9 Nov 0.93 0.90 -0.33 0.30 -1.0 Nov 0.3 0.90 7.7 7.87 Italy +50.9 Nov 0.90 -0.33 2.24 Netherlands +8.1 0.90 -1.1 0.55 Spain -20.1 Nov +24.3 Nov 0.90 -0.33 +3.7 Q3 nil 0.28 0.49 +9.1 Dec +24.5 Dec -1.4 -0.22 Hungary +11.2 Nov +5.5 Q3 +5.0 289 279 -1.7 0.25 Norway +16.6 Dec 8.30 8.61 +3.5 Poland -3.1 Nov Russia -3.6 11.3 8.22 Sweden -0.8 Dec +22.2 Q3 8.48 0.68 +38.1 Dec 0.99 +0.2 -0.73 -0.10 Turkey -33.7 Nov 3.71 -1.1 11.6 10.9 Australia +0.8 Dec -2.3 1.97 2.70 Hong Kong +13.3 Q3 +2.8 7.79 +1.3 1.84 India -11.1 Q3 -0.6 67.2 -3.8 +8.8 Dec -19.2 Q3 -2.1 -2.3 6.84 7.64 Malaysia +21.1 Dec +5.6 Q3 -3.4 3.43 Pakistan -1.8 105 104 +23.6 1.41 na 2.22 South Korea +87.7 Jan +7.4 1,197 1.40 2.13 Taiwan 31.1 33.3 Thailand 35.0 -2.1 -15.7 Q3 -2.7 14.3 -4.7 18.7 na Brazil +49.5 Jan -1.2 3.92 12.1 10.3 Chile -4.8 Q3 -1.6 647 710 -2.8 0.38 4.16 Colombia -14.8 Nov -13.7 Q3 -4.8 5.91 6.74 -2.9 -2.6 Venezuela -17.8 Q3~ 24.3 14.5 10.4 Egypt -20.8 Q3 -6.9 18.0 7.83 -12.2 17.7 Israel +13.3 Q3 3.75 0.12 Saudi Arabia +28.9 2015 -5.7 3.75 3.75 -11.4 1.96 South Africa -12.3 Q3 -3.4 Estonia -1.8 Dec +0.5 Nov 0.90 +0.4 Finland -3.2 Dec 0.93 0.90 -2.6 -0.33 Iceland 113 128 +15.5 +34.2 Q3 +7.6 .90 Latvia +0.3 Nov +1.0 0.93 0.90 -1.0 -0.33 na Lithuania nil Q3 0.90 0.80 Luxembourg +3.2 Q3 0.93 +0.4 -0.33 New Zealand -2.9 1.51 3.29 Peru +1.7 Dec 3.28 3.49 na +0.9 47.7 -2.3 2.09 Portugal +0.7 Nov 0.90 +4.2 Dec 0.90 -0.33 +2.9 Nov 0.93 -1.4 Ukraine -3.4 04 -2.7 26.0 Vietnam +1.6 Jan +2.0 2015 +1.8 22,655 22,305 4.80 Source: Haver Analytics. The Economist poll or Economist Intelligence Unit estimate/forecast. #New series. ~2014 $$5-year yield. it Dollar-denominated bonds
Step by Step Solution
There are 3 Steps involved in it

Get step-by-step solutions from verified subject matter experts