

Question: For this activity, create a spreadsheet that will evaluate two mutually exclusive alternatives. See the Chapter 8 summary that provides a list of what this

For this activity, create a spreadsheet that will evaluate two mutually exclusive alternatives. See the Chapter 8 summary that provides a list of what this model will include as output. Examples of the types of graphs that should be included are presented throughout Chapter 8.
- Clearly identify all alternatives (your model should evaluate three alternatives).
- Construct an NPW or EUAW (or EUAC) graph showing all alternatives plotted on the same axis. This may need to simply involve generating the Table of Values used to generate the graph and then include some instructions for the user to create the graph.
- Create a choice table.
For your model, solve the following problem:
Wayward Airfreight is considering a new automatic parcel sorter. Each choice has a 7-year life.
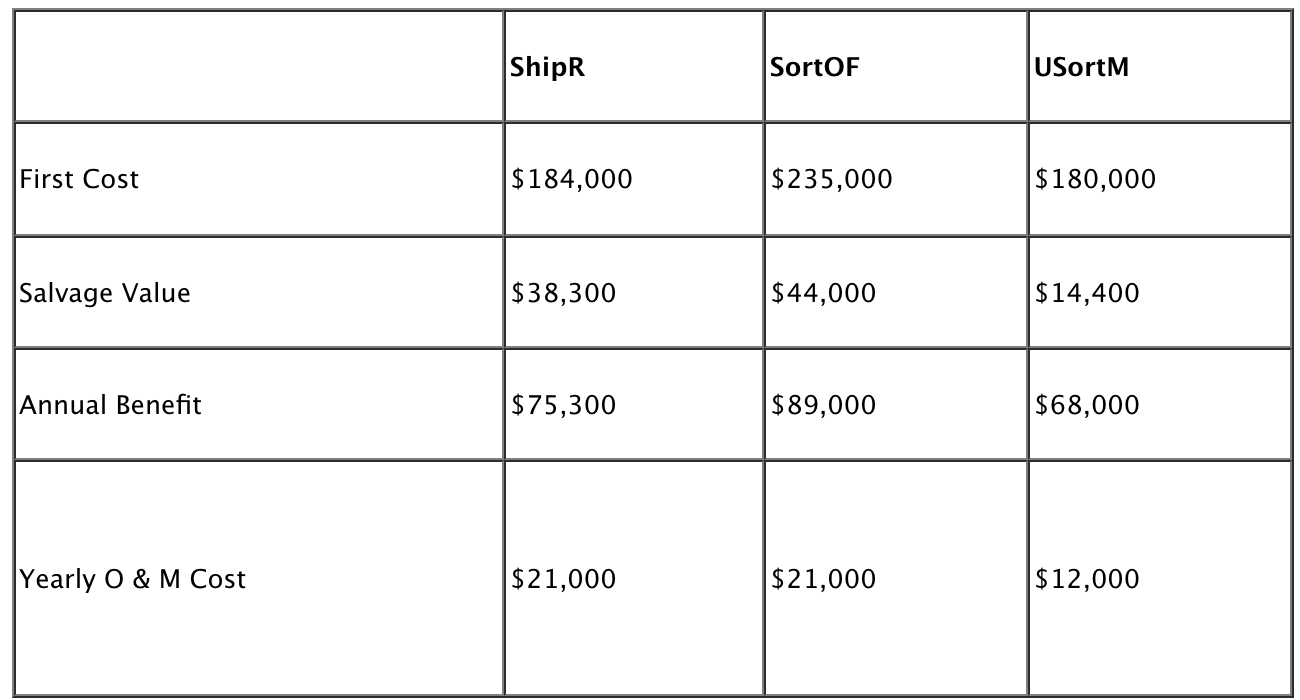
ShipR SortOF USortM First Cost $184,000 $235,000 $180,000 Salvage Value $38,300 $44,000 $14,400 Annual Benefit $75,300 $89,000 $68,000 Yearly O & M Cost $21,000 $21,000 $12,000
Step by Step Solution
There are 3 Steps involved in it
1 Expert Approved Answer
Step: 1 Unlock

Question Has Been Solved by an Expert!
Get step-by-step solutions from verified subject matter experts
Step: 2 Unlock
Step: 3 Unlock