

Question: For this assignment, please submit a report on the mini case at the end of chapter 13 in the textbook. The mini case is titled
For this assignment, please submit a report on the mini case at the end of chapter 13 in the textbook. The mini case is titled "Ferrari's IPO - The Potential of the Prancing Horse."
Your report should consist of the following:
- Briefly, summarize the key facts of the case, identify the problem/decision, and explain why it is important.
- Your case report should cover the following questions/topics:
- Ferrari believed its value arose from scarcity. Do you agree with Ferrari's leadership that a slow volume growth strategy to maintain that scarcity is the best strategy for the company in order to maximize value for investors?
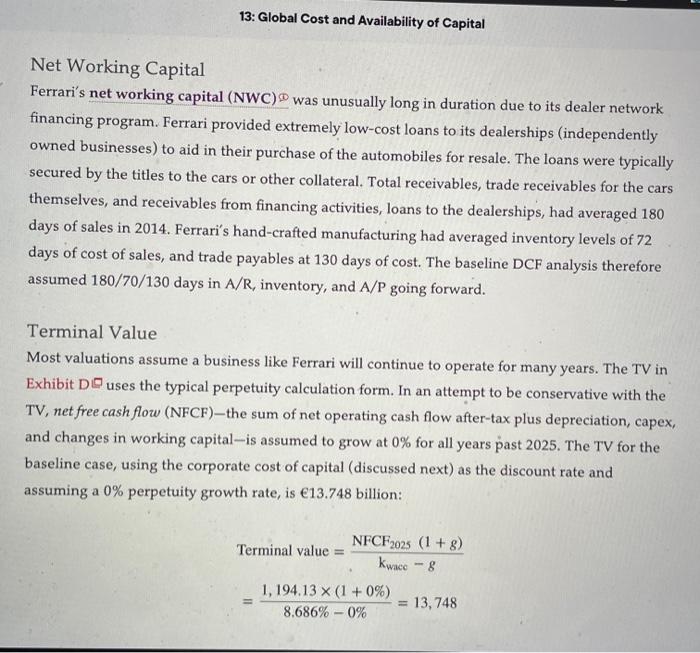
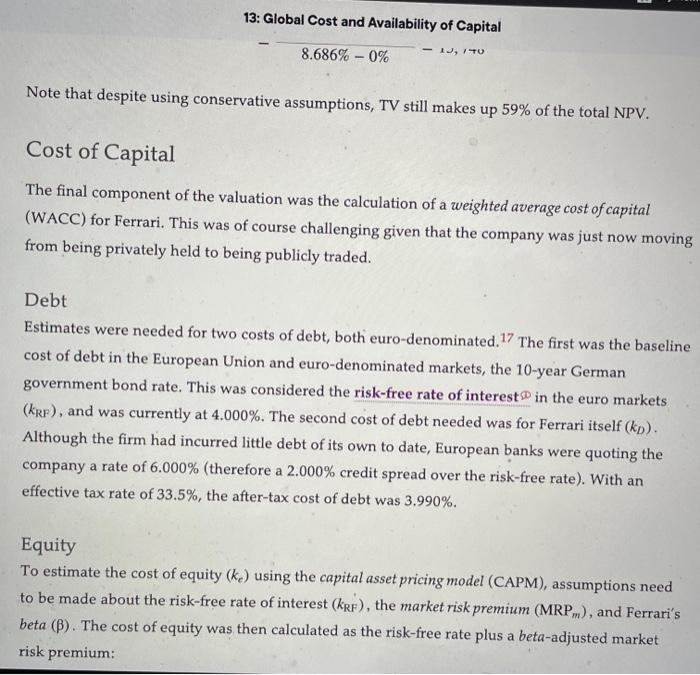
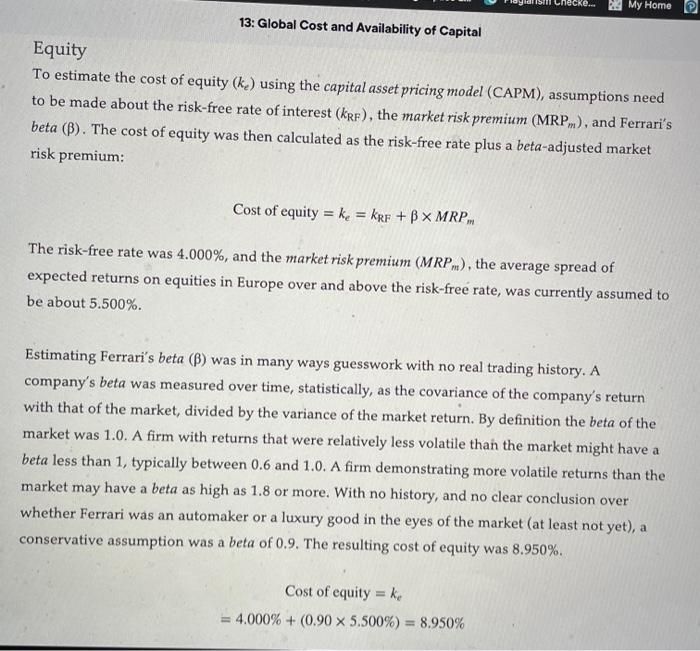
- Comment on important assumptions used in the DCF analysis, specifically including assumptions relating to Price Growth, R & D Expenses, Terminal Value and Cost of Capital.
- Based on the DCF analysis and other information provided in the case, do you think that the IPO was correctly priced?
As you carry out your analysis, keep in mind the following:
- What are some alternative approaches to addressing the case questions?
- Are your comments based on appropriate analysis and backed up with rationales?
- Does the analysis (both what is presented in the case and any of your own) have any limitations?
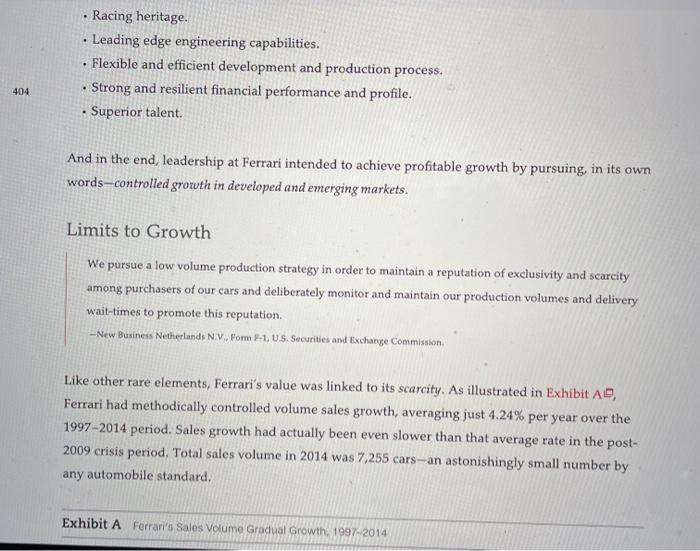
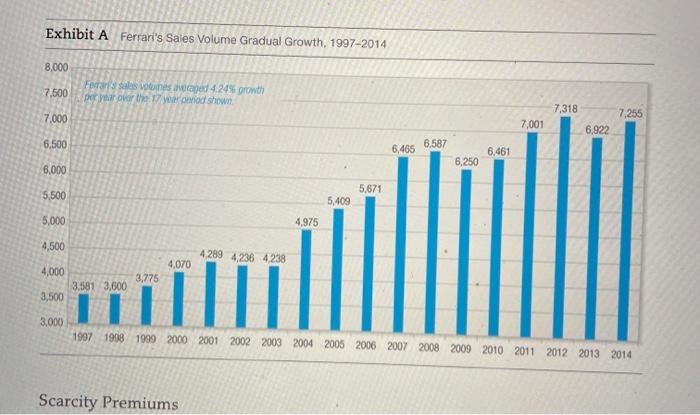
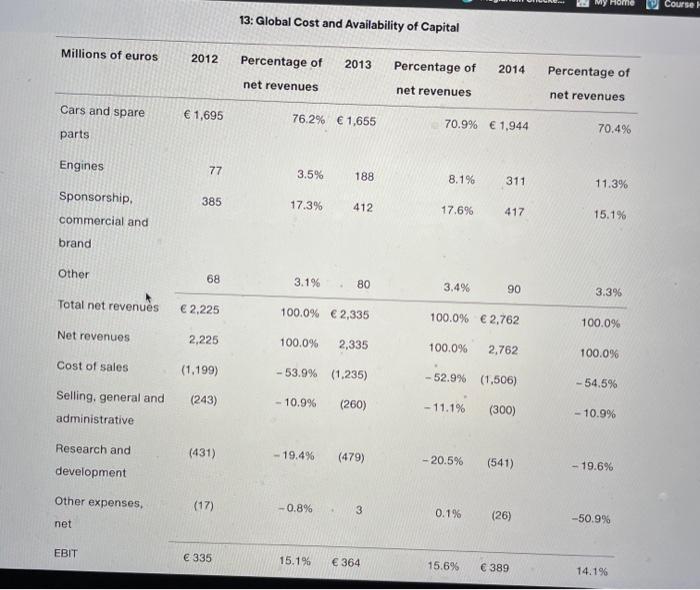
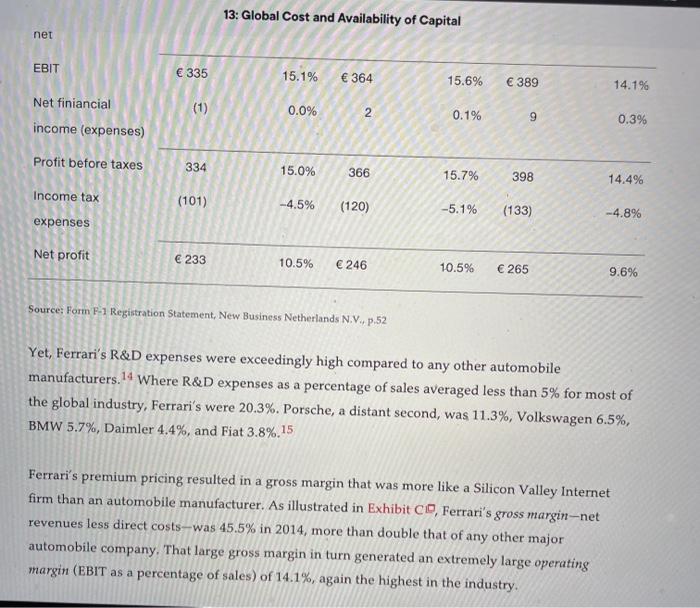
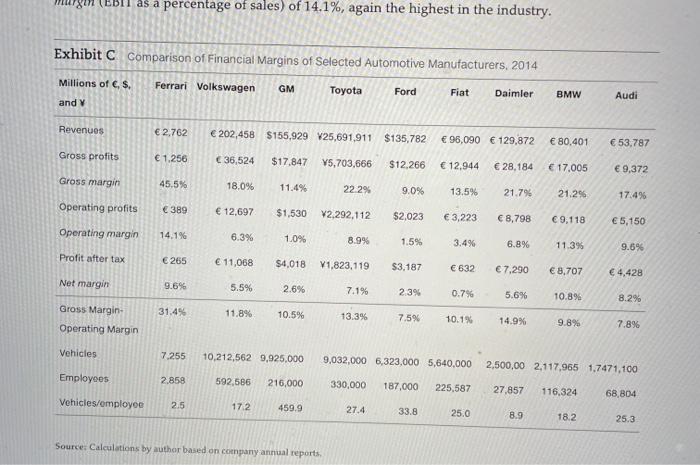
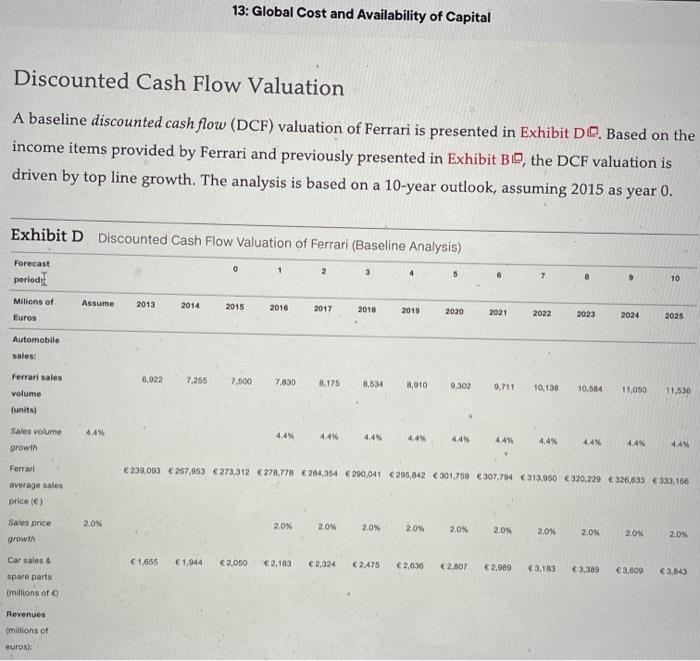
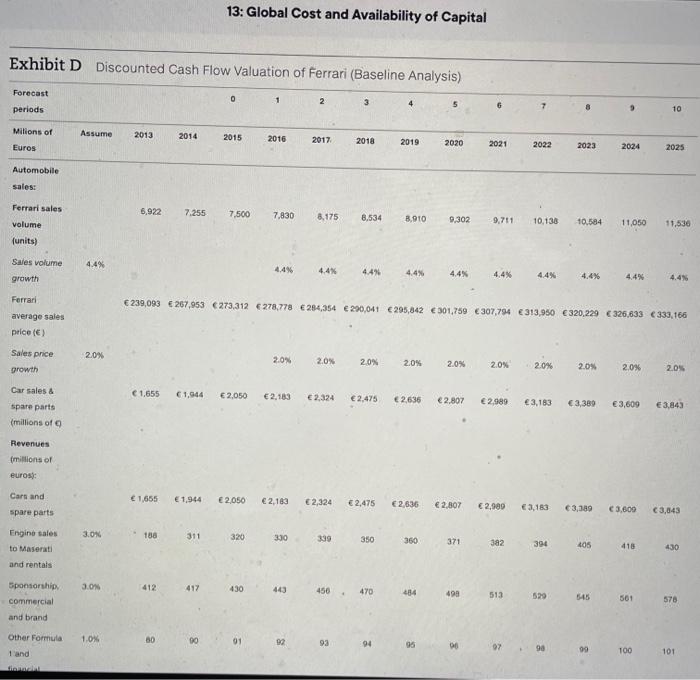
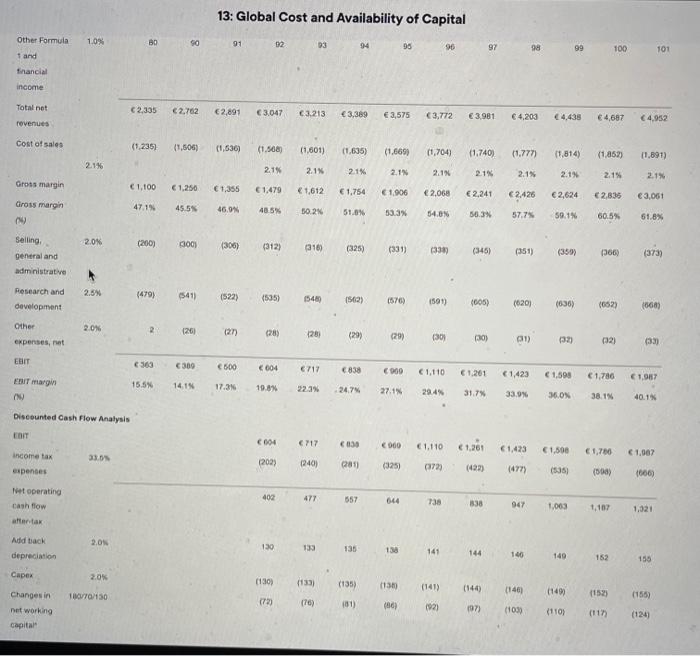
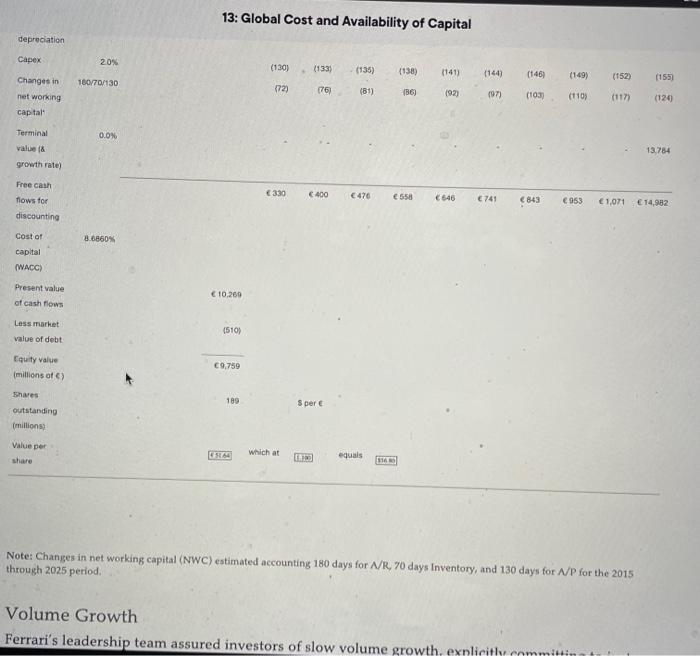
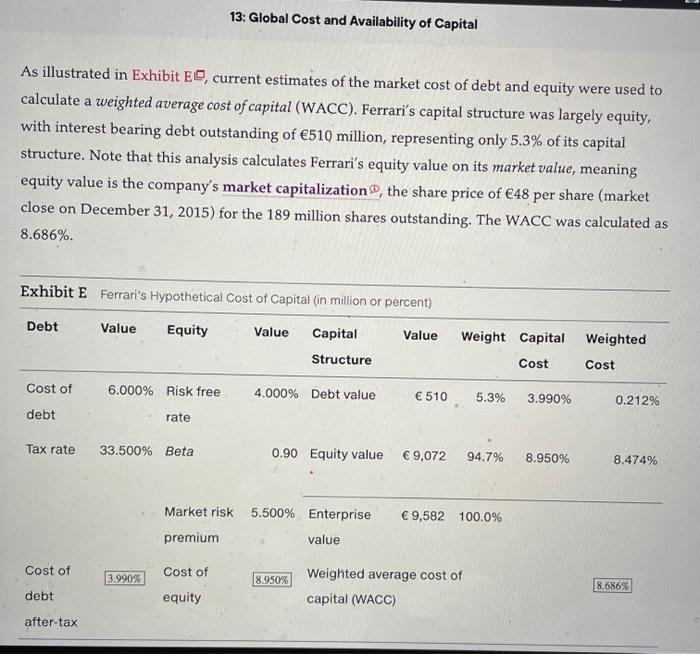
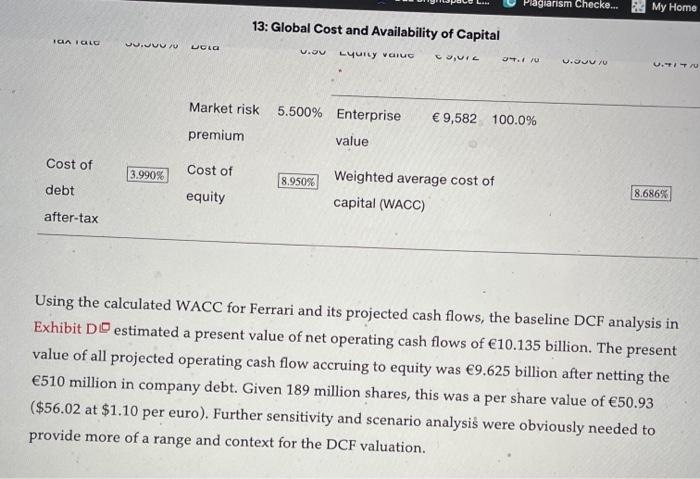
Mini-Case Ferrari's IPO-The Potential of the Prancing Horse Tuesday September 20, 2015. Project Owl-the code name for the initial public offering (IPO) of Ferrari, was over. Officially, in all of the documents filed with authorities like the U.S. Securities and Exchange Commission, the company had been called New Business Netherlands N.V., now to be renamed Ferrari N.V. The prancing horse had opened at the top end of its target price range- $52 per share in the U.S. -raising nearly $1 billion for Ferrari's owner, Fiat. Like most IPOs, the share price of RACE (the ticker symbol for Ferrari) settled in the weeks following the launch. But now many analysts and mutual fund managers were all asking the same thing: Was Ferrari a promising equity or simply another of the equity eye candy IPOs to hit the market in recent years? The Ferrari Legacy If you can dream it, you can do it. -Enzo Ferrari Ferrari was the namesake of Enzo Ferrari. An automotive engineer his entire life, Enzo worked with Alfa Romeo for many years, performing every possible function including lathe instructor, test driver, racing driver, and eventually, serving as the director of the Alfa Corse racing division. In 1929 Enzo founded Scuderia Ferrari in Modena, Italy. Scuderia was a racing stable, where owners could drive and compete with their own cars. Enzo left Alfa Romeo in 1939 to open his own firm, Avio Costruzioni on Viale Trento Tieste in Modena (the plant was eventually moved to Maranello). After the forced hiatus during the second world war, Ferrari launched the 125 S in 1947, and on May 25, 1947, the Ferrari 125 S won its first race, the Rome Grand Prix, Ferrari has since won more than 5,000 races worldwide. The financial pressures of sustaining the growing high-powered Ferrari family of cars resulted in Enzo partnering with the Fiat Group in 1969, Fiat initially taking a 50% interest, then increasing it to 90% in 1988. Enzo's remaining 10% ownership was passed to his son in that same year with his death. It was now the Fiat Group and its family interests that sustained Enzo Ferrari's legacy. That legacy was now led by Fiat's new CEO, Sergio Marchionne. Core Characteristics Ferrari believed it possessed a number of core pillars, characteristics that formed the foundations of its value and value-growth potential. 10 An iconic brand with superior, enduring power, benefitting from a loyal customer base. Global access to growing wealth creation. Exceptional pricing power and value resilience. Racing heritage. . . . Racing heritage. Leading edge engineering capabilities. Flexible and efficient development and production process. Strong and resilient financial performance and profile. Superior talent. 404 And in the end, leadership at Ferrari intended to achieve profitable growth by pursuing in its own words-controlled growth in developed and emerging markets. Limits to Growth We pursue a low volume production strategy in order to maintain a reputation of exclusivity and scarcity among purchasers of our cars and deliberately monitor and maintain our production volumes and delivery wait-times to promote this reputation. -New Business Netherlands N.V. Form I-1, US Securities and Exchange Commission Like other rare elements, Ferrari's value was linked to its scarcity. As illustrated in Exhibit AC, Ferrari had methodically controlled volume sales growth, averaging just 4.24% per year over the 1997-2014 period. Sales growth had actually been even slower than that average rate in the post- 2009 crisis period. Total sales volume in 2014 was 7,255 cars-an astonishingly small number by any automobile standard, Exhibit A Ferrari's Sales Volume Gradual Growth, 1997-2014 Exhibit A Ferrari's Sales Volume Gradual Growth, 1997-2014 8,000 7,500 Ferrari es vosged 4 245 growth por over the revod show 7,318 7,000 7,255 7,001 6,922 6.500 6,587 6,465 6.461 6,250 6.000 5,671 5,500 5,409 5,000 4.975 4,500 4289 4,236 4238 4,070 4,000 3.581 3,600 3,500 3,775 ill 3.000 1997 1998 1999 2000 2001 2002 2003 2004 2005 2006 2007 2008 2009 2010 2011 2012 2013 2014 Scarcity Premiums Scarcity Premiums In terms of preserving Ferrari's value, this relative scarcity was both good news and bad news. The good news was that leadership had clearly maintained the product's relative scarcity in a global economy that had grown faster and wealthier at a much more rapid rate. According to a recent study, the number of high net-worth individuals (HNWIS) and their wealth, the target demographic segment for Ferrari sales (at least historically), had grown 8.6% per annum for nearly 30 years. 11 The countries driving Ferrari's sales reflected that wealth creation Sales volumes in 2014 were roughly 45% Europe/Middle East/Africa (EMEA), 35% the Americas, 11% Asia Pacific (APAC), and 9% Greater China. This global sales mix seemed to be shifting slightly away from EMEA, with China and APAC garnering the gains. (Global sales volumes are detailed in Appendix 4.) Diving deeper, four countries made up 60% of this global HNWI population: the United States, Japan, Germany, and China. In its prospectus Ferrari was quite bullish on HNWIs in China. Although China made up only 9% of current sales, the growing wealth and taste for luxury goods in China were promising. China already made up a very large piece of the total sales (2014) for a number of luxury goods producers: Hermes-25%; LVMH --28%; and Prada-30%.12 If that were the case for Ferrari, the company could see growing demand pressures. But there were skeptics, as a number of analysts worried that the Chinese economy was already beginning to slow. 405 The bad news about this relative scarcity through slow growth was that 4% was not a promising growth rate for an equity if sales and earnings did indeed follow volume growth rates. Publicly traded shares generated income for investors two ways, through dividend yields and capital gains. But with no plans to offer dividends, Ferrari's value proposition relied exclusively on hoped-for capital gains. Differing perspectives on growth had also caused serious debate within Ferrari. Ferrari's longtime Chairman, Luca De Montezemolo, had left the firm suddenly in 2015, reportedly over his opposition to the IPO. Montezemolo believed the IPO would force the firm to grow sales volumes at a much more rapid rate. Ferrari's CEO, Sergio Marchionne, had repeatedly stated publicly that Ferrari's future was as a business, not art: There comes a point when exclusivity, ifit becomes unreachable, is no longer exclusivity, it's like you're reading a fiction novel.let's not fool ourselves, we are in the business of selling cars to people. Regulatory Limits There was an even more challenging limit to future growth: European Union (EU) and U.S. government emission and mileage limitations. Ferrari was classified by the EU as a small volume manufacturer (SVM), and therefore subject to much less stringent emission requirements. The EU has, however, been revising these restrictions for the 2017-2021 period, and continued risks and threats to Ferrari persist. Ferrari will be submitting its emissions plan for the 2017-2021 period in the coming year. the coming year. Under current U.S. law, as long as an automobile manufacturer sold fewer than 10,000 units globally per year, it was not subject to U.S. gasoline mileage targets and restrictions. If Ferrari broke that 10,000 unit barrier, however, the car could not be sold in the U.S. market without the company altering its product mix to reach fleet mileage targets. That would mean launching models with smaller engines and better mileage. In its prospectus, Ferrari noted that it had petitioned the EPA for alternative standards for the 2017-2019 period, and would thereafter apply to the National Highway Traffic Safety Administration (NHTSA) for company specific standards under the combined average fuel economy (CAF) clause. In both cases, Ferrari noted that it expected to benefit from a derogation from currently applicable standards."13 In addition, it was rumored that development of an electrically powered version was underway, which would aid in meeting fleet targets. Porsche, for example, had just announced a purely electrically powered model. Financial Performance 406 Ferrari's financial results for the 2012-2014 period appear in Exhibit B. The company had a relatively small product portfolio, consisting of eight vehicles that accounted for 70% of total revenue. Its sales and rentals of engines were exclusively to Maserati (it had supplied engines to Maserati since 2003), and its other sponsorship income was tied to Formula 1 racing. My Home Course! 13: Global Cost and Availability of Capital Millions of euros 2012 Percentage of 2013 Percentage of 2014 Percentage of net revenues net revenues net revenues Cars and spare 1,695 76.2% 1,655 70.9% 1,944 70.4% parts Engines 77 3.5% 188 8.1% 311 11.3% 385 Sponsorship commercial and 17.3% 412 17.696 417 15.1% brand Other 68 3.1% 80 3.4% 90 3.396 Total net revenues 2,225 100.0% 2,335 100.0% 2,762 100.0% Net revenues 2,225 100.0% 2,335 100.0% 2,762 100.0% Cost of sales (1.199) - 53.9% (1.235) -52.9% (1,506) -54.5% Selling, general and administrative (243) - 10.9% (260) - 11.1% (300) - 10.9% Research and (431) - 19.4% (479) -20.5% (541) - 19.6% development Other expenses, (17) -0.8% 3 0.1% (26) -50.9% net EBIT 335 15.1% 364 15.6% 389 14.1% 13: Global Cost and Availability of Capital net EBIT 335 15.1% 364 15.6% 389 14.1% 1 (1) Net finiancial income (expenses) 0.0% 2 0.1% 9 0.3% Profit before taxes 334 15.0% 366 15.7% 398 14.4% Income tax (101) -4.5% (120) -5.1% (133) -4.8% expenses Net profit 233 10.5% 246 10.5% 265 9.6% Source: Form 1 Registration Statement New Business Netherlands N.V., p.52 Yet, Ferrari's R&D expenses were exceedingly high compared to any other automobile manufacturers.14 Where R&D expenses as a percentage of sales averaged less than 5% for most of the global industry, Ferrari's were 20.3%. Porsche, a distant second, was 11.3%, Volkswagen 6.5%, BMW 5.7%, Daimler 4.4%, and Fiat 3.8%.15 Ferrari's premium pricing resulted in a gross margin that was more like a Silicon Valley Internet firm than an automobile manufacturer. As illustrated in Exhibit C, Ferrari's gross margin-net revenues less direct costs-was 45.5% in 2014, more than double that of any other major automobile company. That large gross margin in turn generated an extremely large operating margin (EBIT as a percentage of sales) of 14.1%, again the highest in the industry. 18m as a percentage of sales) of 14.1%, again the highest in the industry. Exhibit C Comparison of Financial Margins of Selected Automotive Manufacturers 2014 Millions of e, $. Ferrari Volkswagen GM Toyota Ford Fiat Daimler BMW Audi and Revenues 2,762 202,458 $155.929 V25,691,911 $135,782 96,090 129,872 80,401 53,787 Gross profits 1.256 36,524 $17.847 V5,703,666 $12.266 12,944 28,184 17,005 9,372 Gross margin 45.5% 18.0% 11.4% 22 29 9.0% 13.5% 21.79 21.29 17.4% Operating profits 389 12.697 $1,530 V2,292,112 $2,023 3,223 8,798 9,118 5,150 Operating margin 14.1% 6.3% 1.0% 8.9% 1.5% 3.4% 6.8% 11.3% 9.6% Profit after tax 265 11,068 $4.018 V1.823,119 $3,187 632 7,290 8,707 4,428 Net margin 9.6% 5.5% 2.6% 7.1% 23 0.796 5.6% 10.89 8.2% 31.4% 11.8% Gross Margin- Operating Margin 10.5% 13.3% 7.5% 10.1% 14.9% 9.8% 7.8% Vehicles 7.255 10,212,562 9,925.000 9,032,000 5,323,000 5,640,000 2,500,00 2.117,965 1.7471,100 Employees 2.858 592,586 216,000 330,000 187,000 225,587 27,857 116.324 68,804 Vehicles/employee 2.5 172 459.9 27.4 33.8 25.0 8.9 18.2 25.3 Source: Calculations by author based on company annual reports The spread between the two margins, gross less operating, was-at 31-delivering financial results far beyond an automaker. That same spread averaged only 12% amongst a peer group of luxury automobile manufacturers, and was twice that of other major players. 16 This despite the fact Ferrari was dwarfed by the others in terms of size in vehicles sold, employees, revenues, or even total profits. The question was whether Ferrari could maintain those margins over the next five to seven years as it continued to grow volume sales. Some analysts argued that as volume sales grew, R&D expenses as a percentage of revenues would not grow as fast, as the company enjoyed scale benefits of previous investment. Others, however, argued that the company would struggle to maintain its current investment and expense structure as it worked hard to maintain its performance edge and brand value. Ferrari's IPO on Tuesday, October 20, 2015, was by all standards a huge success. Of the 189 million shares authorized in Ferrari's incorporation, 17.2 million (9.1%) were sold to the public. At a launch price of $52 per share, Fiat raised $894.4 million. The over-subscription allowance raised another $28.6 million, bringing the total to $923 million. 407 One of the drawbacks associated with the IPO was that the capital raised was not targeted for reinvestment into the business, as was common in many IPOs, but rather to compensate existing owners (Fiat) for reducing their interest. For a company that believed in investing in technology, this was a loss. 13: Global Cost and Availability of Capital Discounted Cash Flow Valuation A baseline discounted cash flow (DCF) valuation of Ferrari is presented in Exhibit D. Based on the income items provided by Ferrari and previously presented in Exhibit BO, the DCF valuation is driven by top line growth. The analysis is based on a 10-year outlook, assuming 2015 as year 0. Exhibit D Discounted Cash Flow Valuation of Ferrari (Baseline Analysis) Forecast period 0 2 3 4 9 10 Assume 2013 2014 Milions of Euros 2015 2016 2017 2010 2019 2020 2021 2022 2023 2024 2025 Automobile sales 6,022 7.255 7.500 7.830 8,175 8,534 8,010 9.302 0,711 10,130 10,584 Ferrari sales volume (units) 11,050 11.530 4.4% 4.4 Sales volume growth 44% 4.4% 4.4% 445 44% 4.4 4.4% 4.4% 44N 239,093 257,953 273,312 278.778 284,054 290,041 205,642 301.750 C307,794 313,960 320,229 326,633 333,166 Ferrari average sales price (e) Sales price 2,0 2.0% 2.0% 20% 20% 2.0% 2.ON 2.0% 2.0 20% growth 2.05 Car sales & (1,655 1,944 2.050 2,183 2,024 2.475 2,636 2.807 2,989 3.183 3,389 3,609 spare parts 3.843 millions of Revenues millions of euros 13: Global Cost and Availability of Capital Exhibit D Discounted Cash Flow Valuation of Ferrari (Baseline Analysis) Forecast periods 0 1 4 9 10 Milions of Assume 2013 2014 2015 2016 2017 2018 2019 2020 2021 2022 Euros 2023 2024 2025 Automobile sales: 6,922 7.255 7,500 7,830 8,175 8,534 8.910 9.302 Ferrari sales volume (units) 9.711 10,138 10.584 11,050 11.530 4.4% Sales volume growth 4.4% 4.4% 4.4% 4.4% 4.4% 4,4% 4.4% 4.4% 4.4% 239,093 267,953 273,312 278,778 284,354 290,041 295,842 301.750 307,794 313,950 320.229 326,633 333,166 Ferrari average sales price (6) 20% Sales price growth 2.0% 2.0% 20% 20% 2.0% 2.0% 2.0% 2.0% 2,0% 2.05 Car sales & 1,655 61,944 2.050 2.183 2.324 2,475 2,636 2.807 2.989 3,183 3,389 3,609 3,843 Spare parts (millions of Revenues (millions of eurost: Cars and 1,655 1,944 2,050 2,183 2,324 2.475 2,6:36 2,807 2,989 3,183 spare parts 3,380 3.600 3,843 3.0% 188 311 320 330 339 350 360 371 392 394 405 Engino sales to Maserati and rentals 416 430 3.0% 412 417 430 443 450 470 484 499 513 Sponsorship commercial and brand 520 545 501 578 1.0% 80 90 8 Other Formula Hand 01 92 93 94 96 18 & TOO 101 Com 13: Global Cost and Availability of Capital Other Formula 1.0% 30 100 91 102 03 94 95 97 98 99 100 101 1 and financial income Total net C 2,335 2,762 2,891 3.047 C3213 3,369 3.575 (3.772 3,981 4,203 4,435 4,687 4.952 revenues Cost of sales (1.235) (1.506) (1,636) (1.506 (1,601) (1,635) (1.669 (1,704) (1.740) (1.777) (1.814) (1.852) 11.891) 2.196 2.1% 2.1% 21% 2.1 2.18 2.1 2.1% 2.1% 2.1% 2.1% Gross margin C 1.100 1.250 1,355 61,479
Step by Step Solution
There are 3 Steps involved in it

Get step-by-step solutions from verified subject matter experts