

Question: For this assignment, revisit Research Project 1 from Week 4, which consisted of data collected from a random sample of N = 340' certied ight
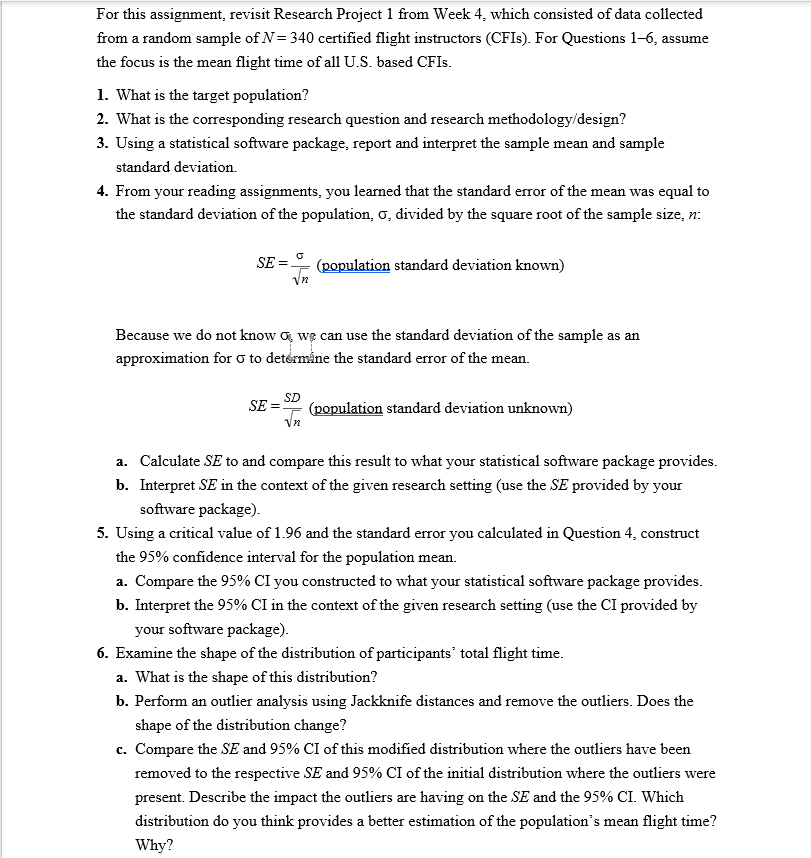
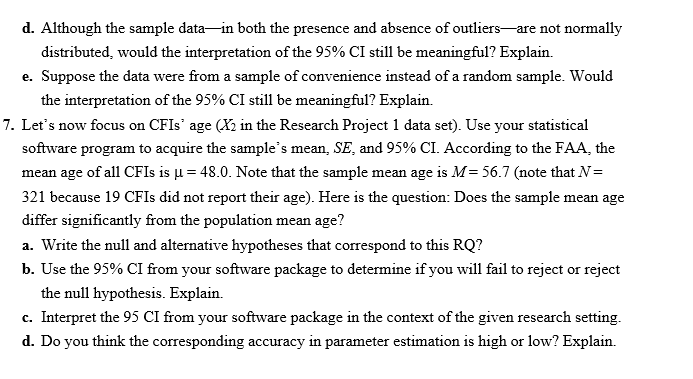
For this assignment, revisit Research Project 1 from Week 4, which consisted of data collected from a random sample of N = 340' certied ight instructors (CFIs). For Questions 16, assume the focus is the mean ight time of all U.S. based CFIs. 1. What is the target population? 2. What is the corresponding research question and research methodologyfdesign? 3. Using a statistical soware package= report and interpret the sample mean and sample standard deviation 4. From your reading assignments, you learned that the standard error of the mean was equal to the standard deviation of the population, o, dividedb'yr the square root of the sample size, n: E =1 (m standard deviation known) H ,r Because we do not know {it we can use the standard deviation of the sample as an approximation for {i to detdamline the standard error of the mean. SD SE = {mm standard deviation unknown) H a. Calculate SE to and compare this result to what your statistical software package provides. 1). Interpret SE in the context of the given research setting {use the SE provided by your software package)- 5. Using a critical value of 1.96 and the standard error you calculated in Question 4, construct the 95% condence interval for the population mean. a. Compare the 95% CI you constmcted to what your statistical software package provides. 1). Interpret the 95% CI in the context of the given research setting (use the CI provided by your software package). 6. Examine the shape of the distribution of participants' total ight time. a. 1What is the shape of this distribution? 1). Perform an outlier analysis using Jackknife distances and remove the outliers. Does; the shape of the distribution change?I c. Compare the SE and 95% CI of this modied distribution where the outliers have been removed to the respective SE and 95% CI of the initial distribution where the outliers were present. Describe the impact the outliers are having on the SE and the 95% CI. Which distribution do you think provides a better estimation of the population's mean ight time? 'Why? 1]. Although the sample datam both the presence and absence of outliersare not normally distributed, would the interpretation of the 95% CI still he meaningil? Explain. e. Suppose the data were om a sample of convenience instead of a random sample. 1Would the interpretation of the 95% CI still be meaningful? Explain. . Let's now focus on CFIs' age (X2 in the Research Project 1 data set). Use your statistical software program to acquire the sample: s mean= SE, and 95 % CI. According to the FAA, the mean age ofall CFIs is u = 48.0. Note that the sample mean age is M: 56.5" (note that N = 321 because 19 CFIs did not report their age). Here is the question: Does the sample mean age differ signicantly from the population mean age? a. 1Write the null and alternative hypotheses that correspond to this RQ? I). Use the 95% CI 'om your software package to determine if you will fail to reject or reject the null hypothesis. Explain. c. Interpret the 95 C] from your soware package in the context of the given research setting. 1]. Do yoru think the corresponding accuracy in parameter estimation is high or low? Explain
Step by Step Solution
There are 3 Steps involved in it

Get step-by-step solutions from verified subject matter experts