

Question: For this assignment, select a value stream in your organization that can benefit from analysis and improvement. The value stream (or end-to-end process) selected does
For this assignment, select a value stream in your organization that can benefit from analysis and improvement. The value stream (or end-to-end process) selected does not need to be overly large or complex. Select something that has the potential for meaningful improvement but is manageable within the scope of this assignment.
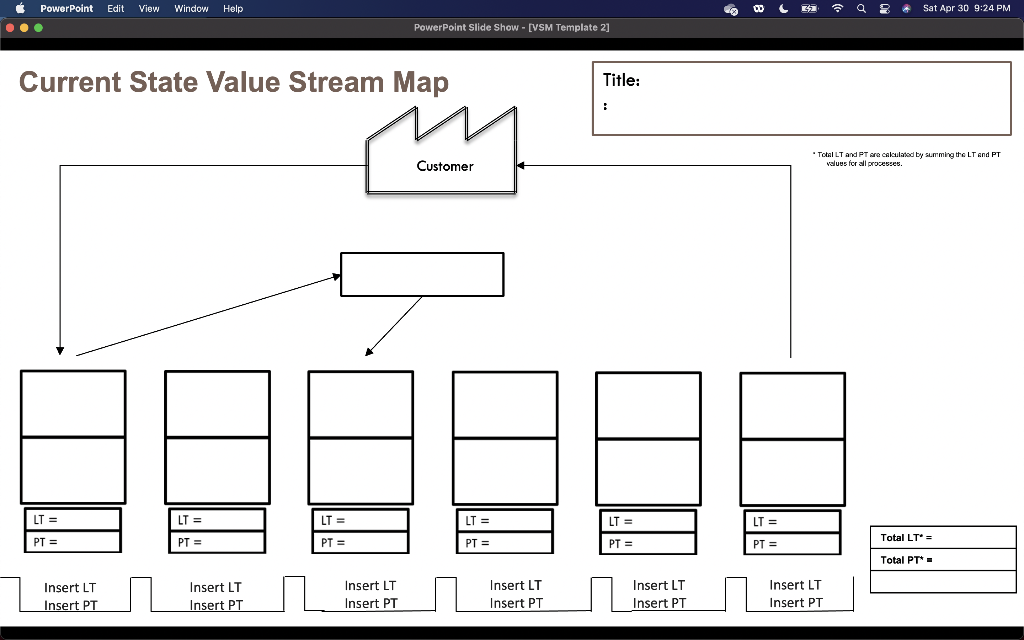
- Develop a current state Value Stream Map of your selected value stream. Show the information flow, workflow, and summary timeline on the map.
- Document key metrics for each process block:
- Process time (PT) these are estimates provided by YOU based upon what you know of the process.
- Lead time (LT) these are estimates provided by YOU based upon what you know of the process.
- Calculate the current state summary metrics:
- Total lead time (Total LT)
- Total process time (Total PT)
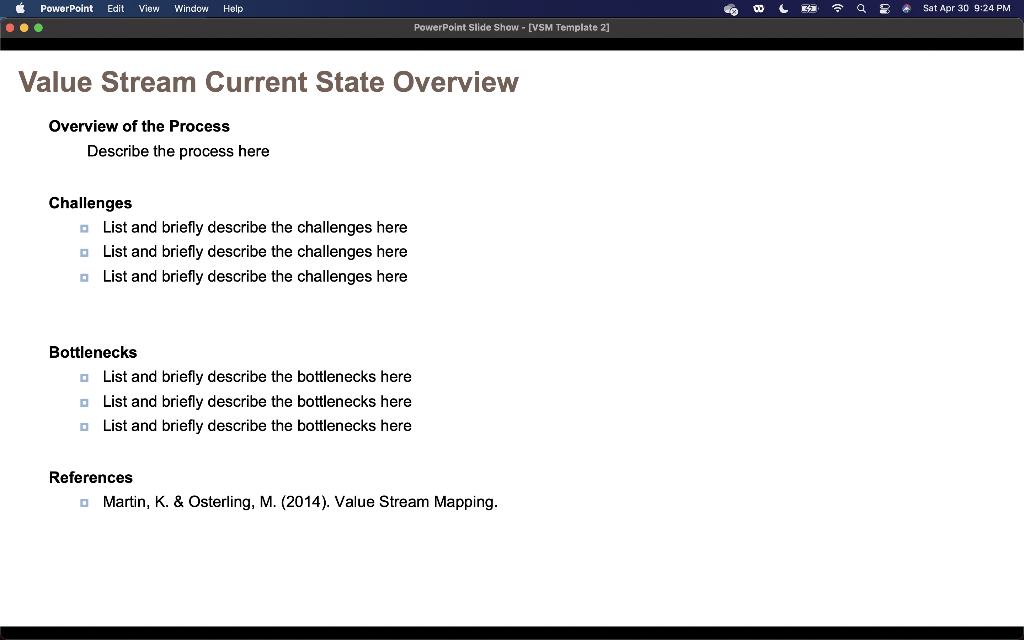
- Describe the current state of the value stream, and highlight any performance deficiencies and challenges, such as delays, excessive WIP, bottlenecks, capacity, and workload imbalances, rework, poor quality yields, long lead times, and other operational
Step by Step Solution
There are 3 Steps involved in it
1 Expert Approved Answer
Step: 1 Unlock

Question Has Been Solved by an Expert!
Get step-by-step solutions from verified subject matter experts
Step: 2 Unlock
Step: 3 Unlock