

Question: For this assignment, use Excel to run descriptive statistics (and frequencies/pivot tables) using Emily's survey data Download Emily's survey data and complete an analysis of
For this assignment, use Excel to run descriptive statistics (and frequencies/pivot tables) using Emily's survey data Download Emily's survey data and complete an analysis of demographic data for those who attended training and those who did not. An short narrative will be included in your assignment submission.
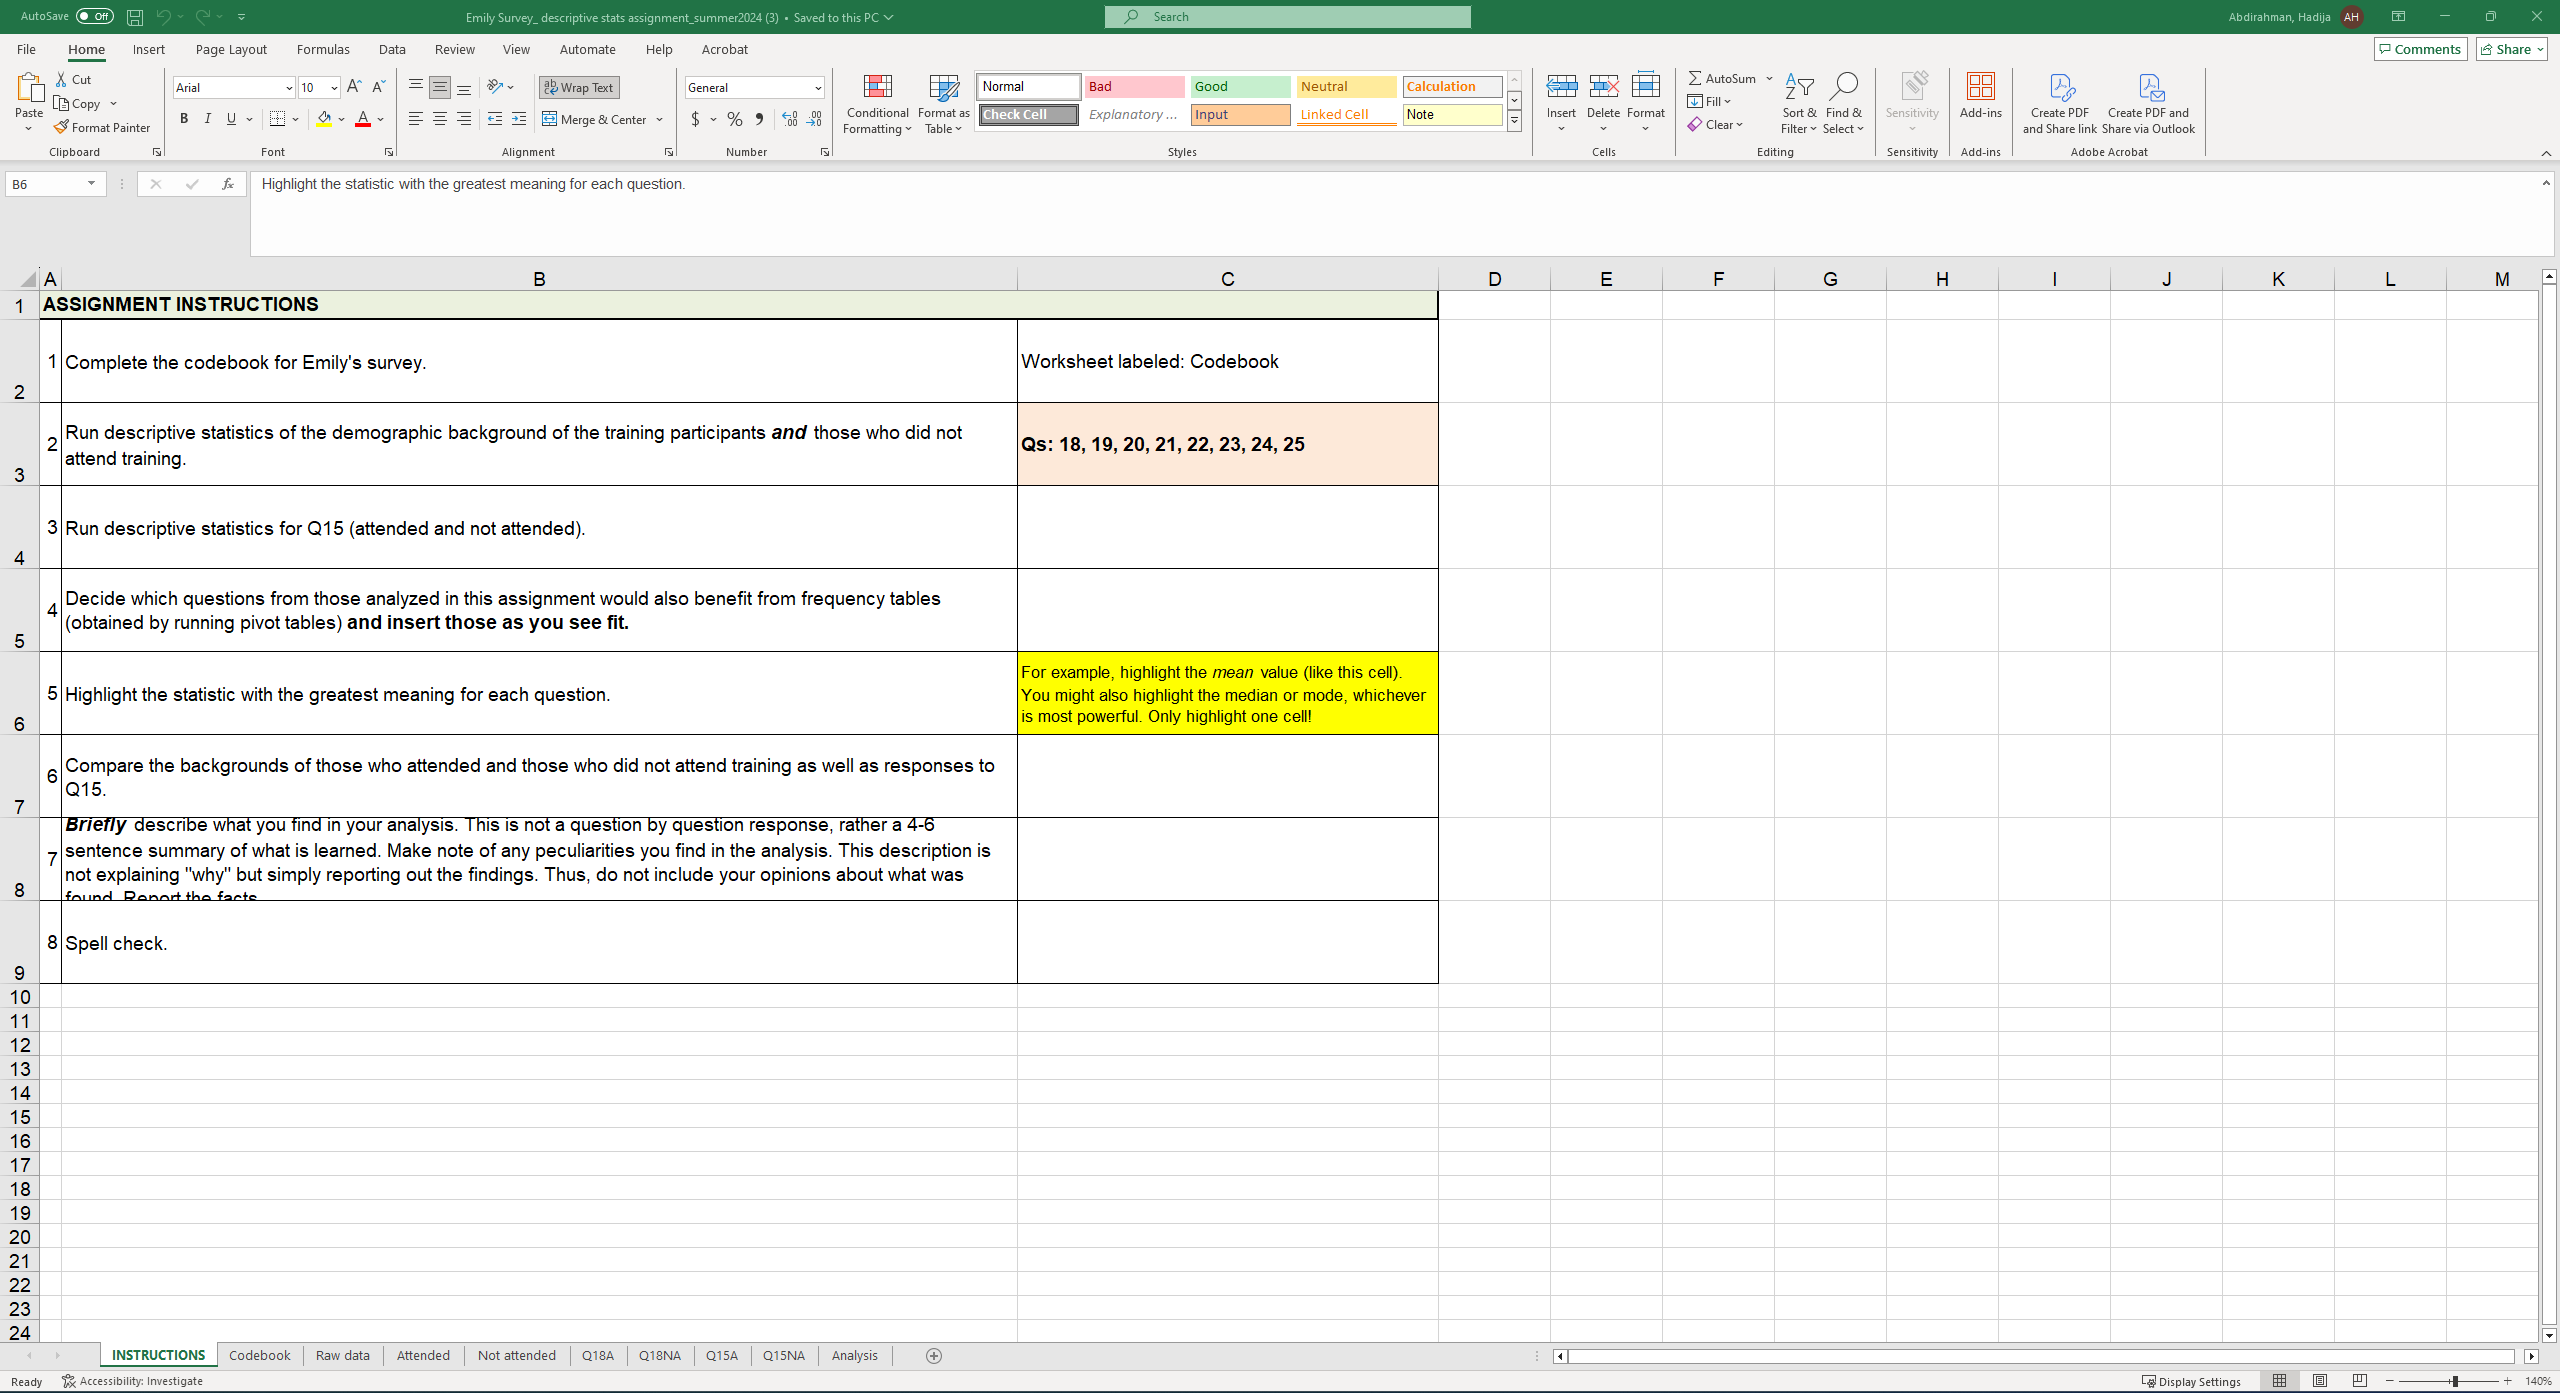
You willgenerate descriptive statistics for the demographic variables and determine which questions may benefit from a frequency table.See instructions in the Excel file as well as the demo video.
The assignment data file includes a number of tabs:
- Instructions. Outlines the expectations for the assignment.
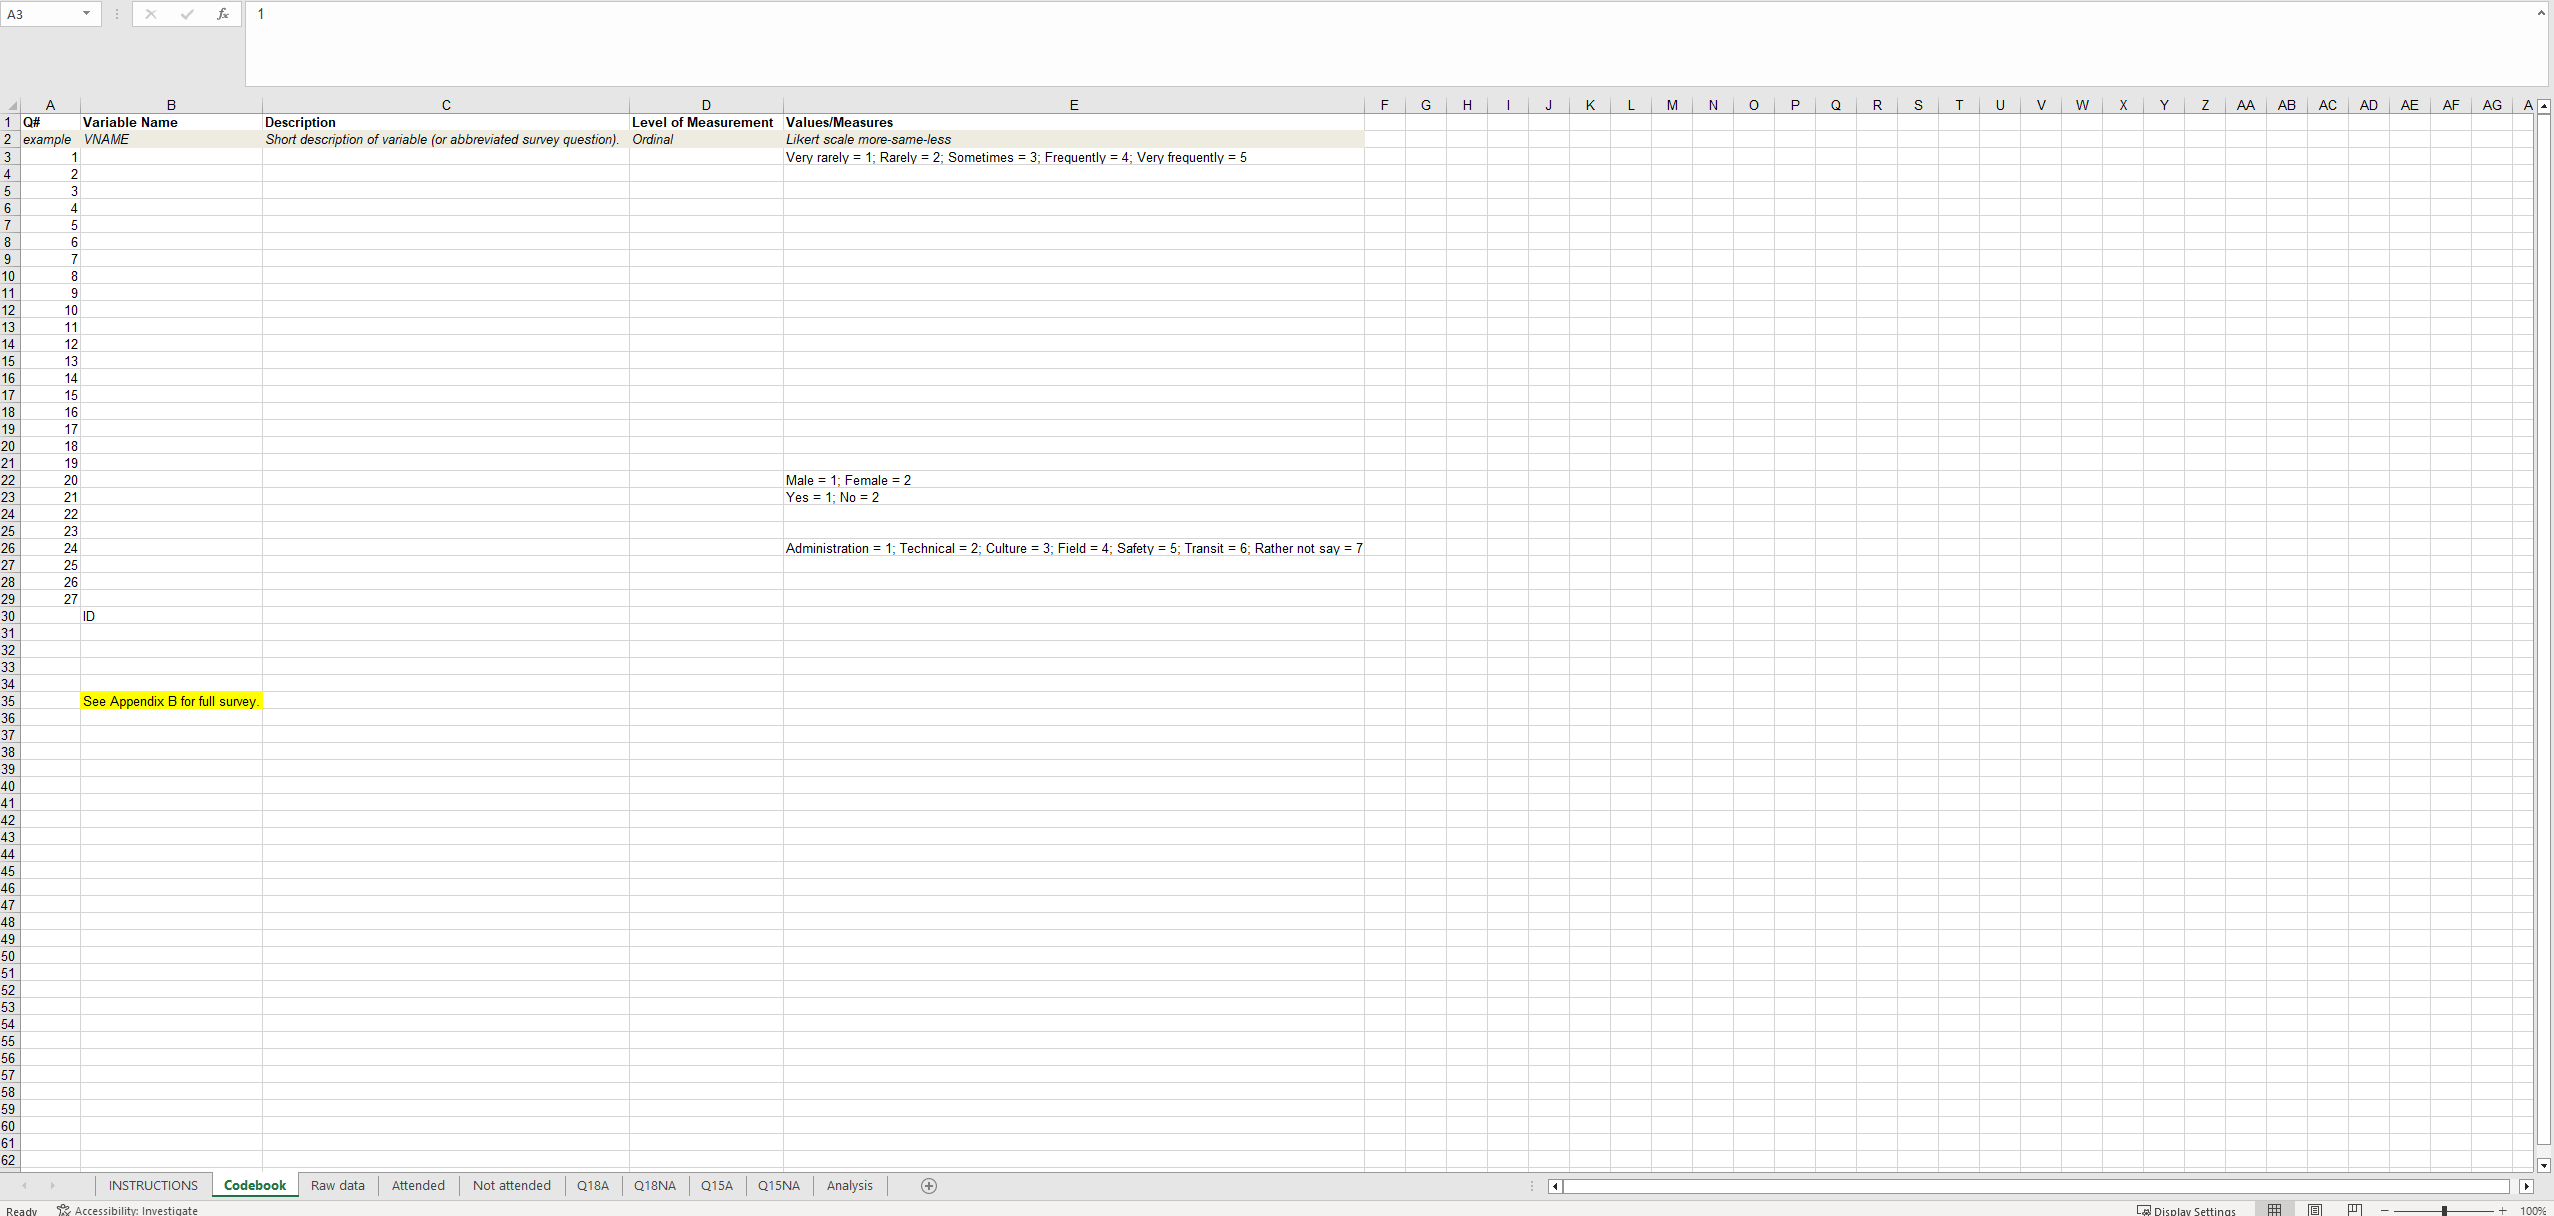
- Codebook. You will complete the codebook following the examples provided earlier in the course. Review these examples so you appropriately label the variable name which is much shorter than the description.
- Raw data. This is the raw data file of all responses to Emily's survey.
- Attended. This worksheet includes data for only those who attended training.
- Not attended. This worksheet includes data for those who DID NOT attend training.
- Q18A. In this worksheet, you can run descriptive statistics for the variable AGE for those who attended training.
- Q18NA. In this worksheet, you can run descriptive statistics for the variable AGE for those who DID NOT attend training.
- Analysis. In the box provided, provide a brief analysis of what you notice when comparing demographics and responses to Q15 from those who attended and did not attend training.
- Q15A. In this worksheet, you can follow along in my demo to run descriptive statistics and a frequency table for responses to Q15 from those who attended training.
- Q15NA. In this worksheet, you can run descriptive statistics and a frequency table for responses to Q15 from those who DID NOT attend training
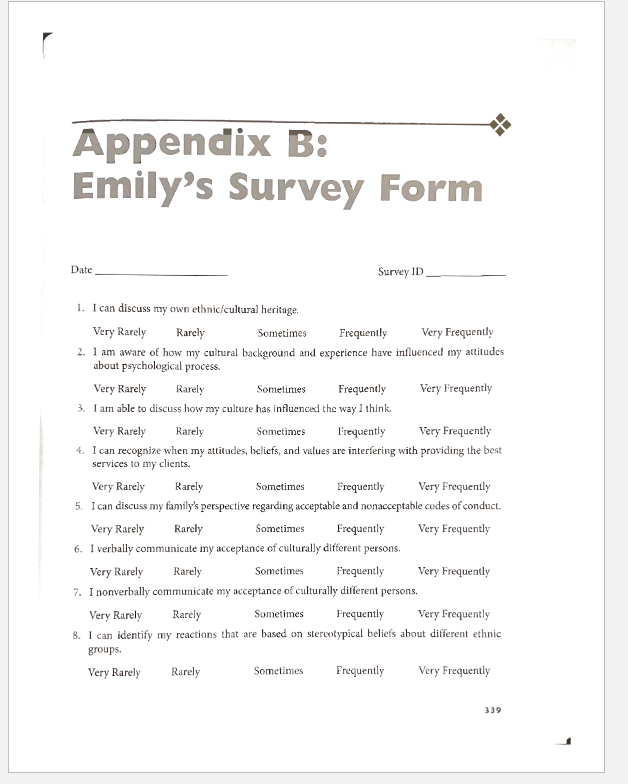
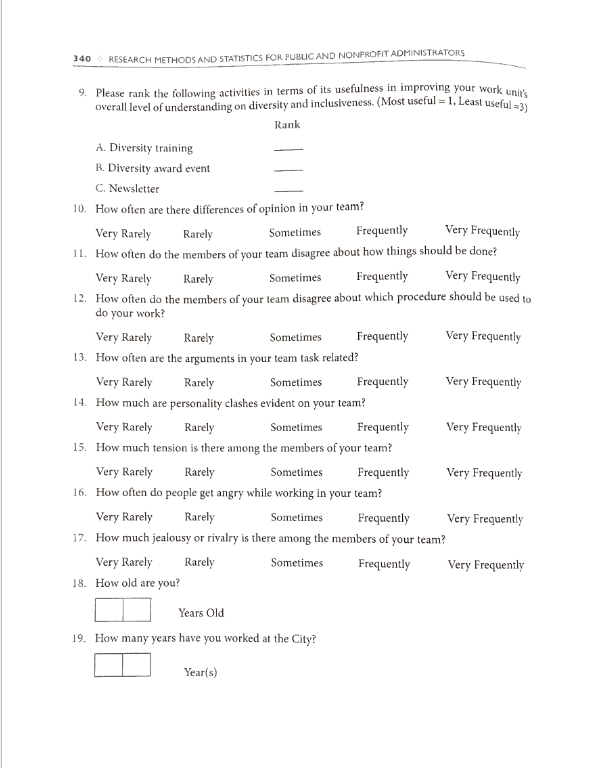
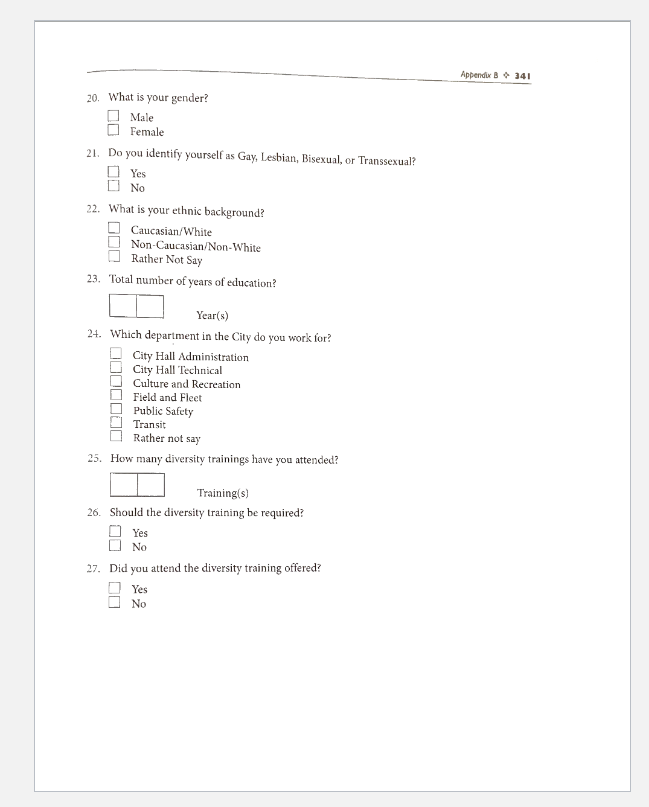
Appendix B: Emily's Survey Form Date Survey ID 1. I can discuss my own ethnic/cultural heritage. Very Rarely Rarely Sometimes Frequently Very Frequently 2. I am aware of how my cultural background and experience have influenced my attitudes about psychological process. Very Rarely Rarely Sometimes Frequently Very Frequently 3. I am able to discuss how my culture has influenced the way I think. Very Rarely Rarely Sometimes Frequently Very Frequently 4. I can recognize when my attitudes, beliefs, and values are interfering with providing the best services to my clients. Very Rarely Rarely Sometimes Frequently Very Frequently 5. I can discuss my family's perspective regarding acceptable and nonacceptable codes of conduct. Very Rarely Rarely Sometimes Frequently Very Frequently 6. I verbally communicate my acceptance of culturally different persons. Very Rarely Rarely Sometimes Frequently Very Frequently 7. I nonverbally communicate my acceptance of culturally different persons. Very Rarely Rarely Sometimes Frequently Very Frequently 8. I can identify my reactions that are based on stereotypical beliefs about different ethnic groups. Very Rarely Rarely Sometimes Frequently Very Frequently 319340
Step by Step Solution
There are 3 Steps involved in it

Get step-by-step solutions from verified subject matter experts