Question: For this assignment, use the actual data provided in coursebook Chapter 4, Example 4, on page 114. As a smoothing constant (), use 0.20 but

For this assignment, use the actual data provided in coursebook Chapter 4, Example 4, on page 114. As a smoothing constant (), use 0.20 but make sure that the user can easily change the value (4 points).

1. Calculate Mean Absolute Deviation (MAD) (4 points)

2. Calculate Mean Square Error (MSE) (4 points)

3. Calculate Mean Absolute Percent Error (MAPE) (4 points)

4. Draw a graph in MS Excel to compare actual and forecast data for = 0.10, 0.20, and 0.50. For = 0.10 and 0.50 use the data provided in the coursebook (4 points)

Show your calculations for each question. For this assignment, use the actual data provided

During the past eight quarters, the Port of Halifax has unloaded large quantities of grain from ships. The port's operations manager wants to test the use of exponential smoothing to see how well the tech- nique works in predicting tonnage unloaded. He guesses that the forecast of grain unloaded in the first quarter was 175 tonnes. Two values of a are to be examined: a = 0.10 and a = 0.50. APPROACH Compare the actual data with the data we forecast (using each of the two a-values) and then find the absolute deviation and MADs. SOLUTION The following table shows the detailed calculations for a = 0.10 only: Actual Tonnage Unloaded Forecast with a = 0.50 Quarter Forecast with a = 0.10 1 180 175 175 2 168 177.50 3 159 172.75 4 175 165.88 5 190 170.44 175.50 = 175.00 + 0.10(180 175) 174.75 = 175.50 + 0.10(168 175.50) 173.18 = 174.75 + 0.10(159 174.75) 173.36 = 173.18 + 0.10(175 - 173.18) 175.02 = 173.36 + 0.10(190 173.36) 178.02 = 175.02 + 0.10(205 175.02) 178.22 = 178.02 + 0.10(180 178.02) 178.59 = 178.22 + 0.10(182 - 178.22) 6 205 180.22 7 180 192.61 8 182 186.30 184.15 9 ? To evaluate the accuracy of each smoothing constant, we can compute forecast errors in terms of abso- lute deviations and MADs: Actual Tonnage Unloaded Forecast with a = 0.10 Absolute Deviation for a = 0.10 Forecast with a = 0.50 Absolute Deviation for Q = 0.50 Quarter 1 180 175 5.00 175 5.00 2 168 7.50 177.50 9.50 175.50 174.75 3 159 15.75 172.75 13.75 4 165.88 9.12 1.82 16.64 5 170.44 19.56 6 29.98 180.22 24.78 7 1.98 192.61 12.61 175 173.18 190 173.36 205 175.02 180 178.02 182 178.22 Sum of absolute deviations: Deviations MAD = n 8 186.30 4.30 3.78 82.45 98.62 10.31 12.33

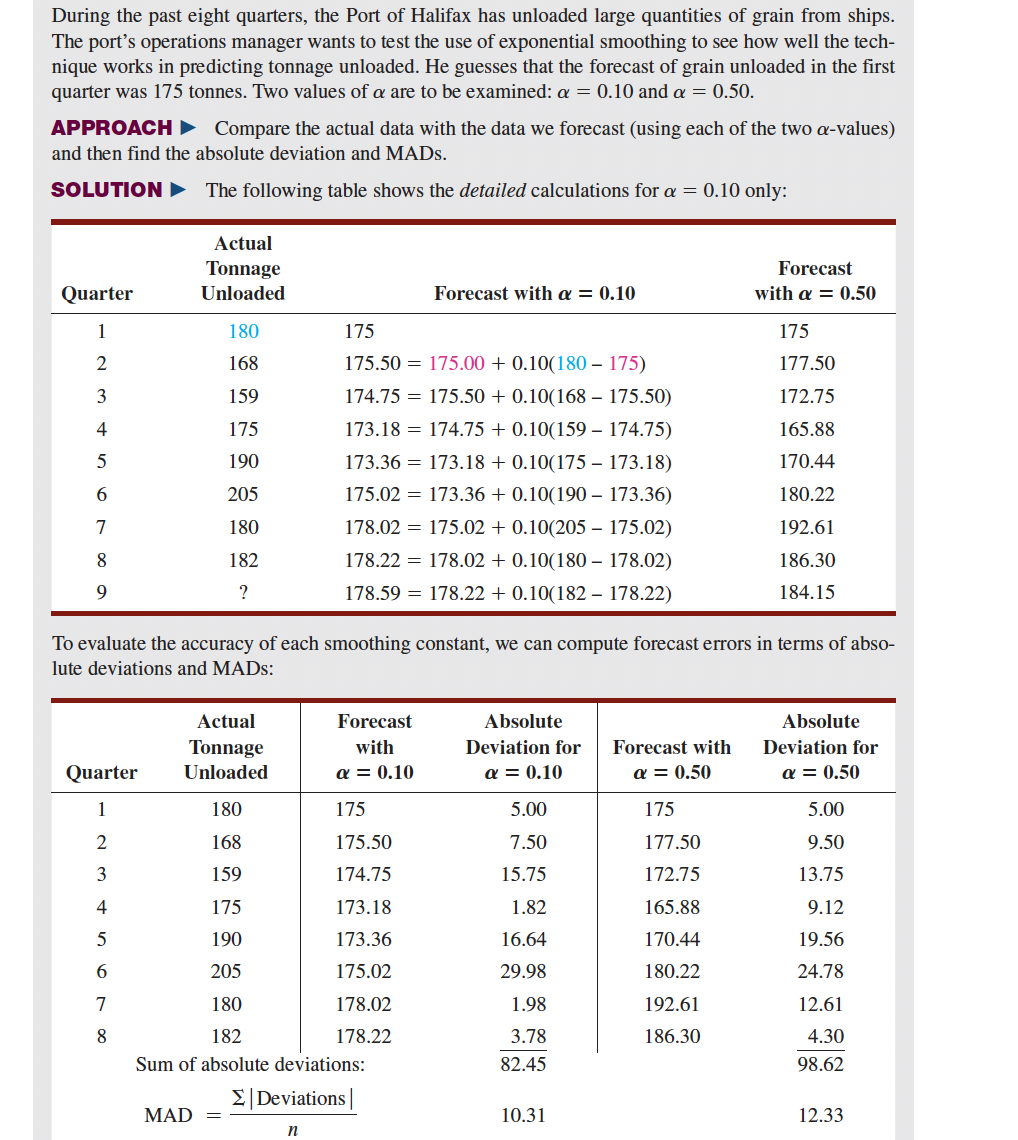
Step by Step Solution

There are 3 Steps involved in it

1 Expert Approved Answer
Step: 1 Unlock blur-text-image
Question Has Been Solved by an Expert!

Get step-by-step solutions from verified subject matter experts

Step: 2 Unlock
Step: 3 Unlock

Students Have Also Explored These Related General Management Questions!