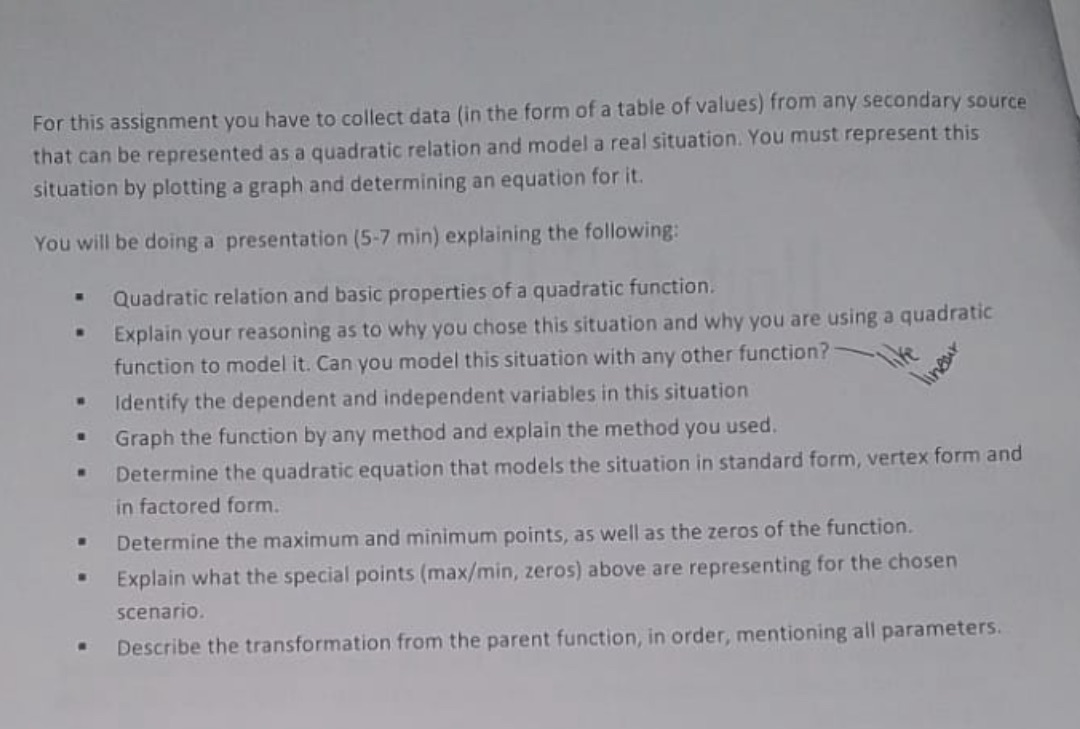
Question: For this assignment you have to collect data (in the form of a table of values) from any secondary source that can be represented as

For this assignment you have to collect data (in
For this assignment you have to collect data (in the form of a table of values) from any secondary source that can be represented as a quadratic relation and model a real situation. You must represent this situation by plotting a graph and determining an equation for it. You will be doing a presentation (5-7 min) explaining the following: . Quadratic relation and basic properties of a quadratic function. Explain your reasoning as to why you chose this situation and why you are using a quadratic function to model it. Can you model this situation with any other function? linear Identify the dependent and independent variables in this situation Graph the function by any method and explain the method you used. Determine the quadratic equation that models the situation in standard form, vertex form and in factored form. Determine the maximum and minimum points, as well as the zeros of the function. Explain what the special points (max/min, zeros) above are representing for the chosen scenario. " Describe the transformation from the parent function, in order, mentioning all parameters

Step by Step Solution

There are 3 Steps involved in it

1 Expert Approved Answer
Step: 1 Unlock blur-text-image
Question Has Been Solved by an Expert!

Get step-by-step solutions from verified subject matter experts

Step: 2 Unlock
Step: 3 Unlock

Students Have Also Explored These Related Mathematics Questions!