

Question: For this assignment, you will be calculating the expected monetary value (EMV) for each risk using the information in the following chart: Questions to answer:
For this assignment, you will be calculating the expected monetary value (EMV) for each risk using the information in the following chart:
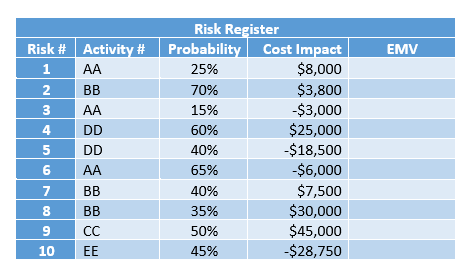
Questions to answer:
How many of the risks identified are positive?
The total sum of the EMV column represents the potential budget for the contingency reserve. Add up all of your EMV calculations. What is the sum?
Which activity has the most risks identified?
Some activities have both positive and negative risks identified. Add all risks for each activity. This calculates the net EMV per activity. Which activity has the highest dollar value for positive risks?
Some activities have both positive and negative risks identified. Add all risks for each activity to calculate the net EMV per activity. Which activity has the lowest dollar value for negative risks?
\begin{tabular}{|c|l|c|r|r|} \hline \multicolumn{5}{|c|}{ Risk Register } \\ \hline Risk \# & Activity \# & Probability & Cost Impact & EMV \\ \hline 1 & AA & 25% & $8,000 & \\ \hline 2 & BB & 70% & $3,800 & \\ \hline 3 & AA & 15% & $3,000 & \\ \hline 4 & DD & 60% & $25,000 & \\ \hline 5 & DD & 40% & $18,500 & \\ \hline 6 & AA & 65% & $6,000 & \\ \hline 7 & BB & 40% & $7,500 & \\ \hline 8 & BB & 35% & $30,000 & \\ \hline 9 & CC & 50% & $45,000 & \\ \hline 10 & EE & 45% & $28,750 & \\ \hline \end{tabular}
Step by Step Solution
There are 3 Steps involved in it

Get step-by-step solutions from verified subject matter experts