

Question: For this assignment, you will practice applying inferential statistical analysis to two business decision scenarios. Complete both following scenarios. Practical Application Scenario 1 Refer to
For this assignment, you will practice applying inferential statistical analysis to two business decision scenarios. Complete both following scenarios.
Practical Application Scenario 1
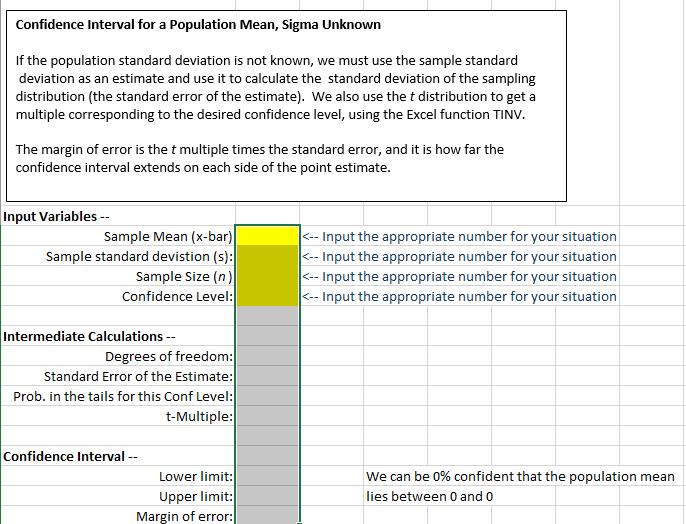
Refer to the stock you selected in Module 1. Using the same downloaded data, build a 95 percent confidence interval for the daily stock volume using Target (TGT) last five year of historical data. What does this confidence interval mean? Why might decision makers be interested in such an interval?
Practical Application Scenario 2
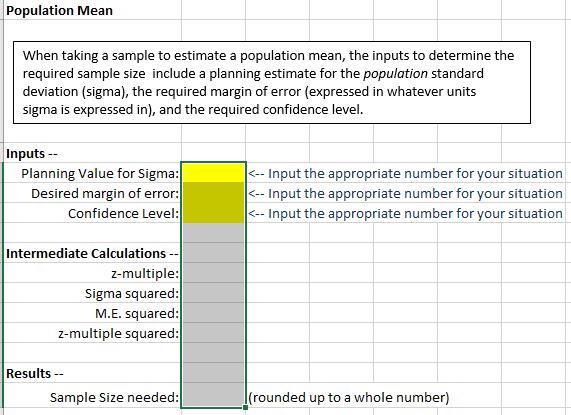
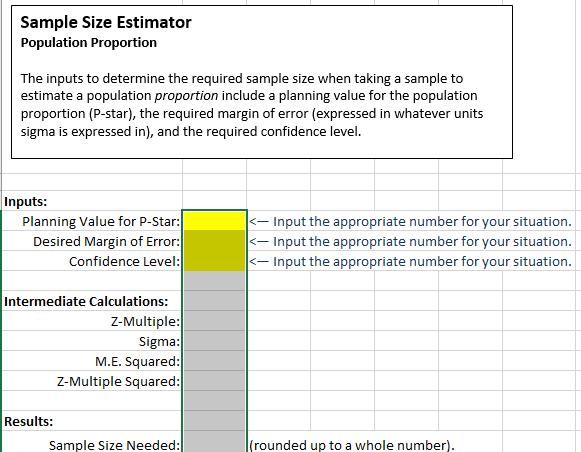
To complete this scenario, use the Sample Size Estimator file provided in Resources.
For the stock you selected in Module 1, what size sample would you need to bracket the adjusted daily closing price within 50 cents (for example, a margin of error of 50 cents)? Use the standard deviation from your data for your calculations, and assume this standard deviation represents the population standard deviation.
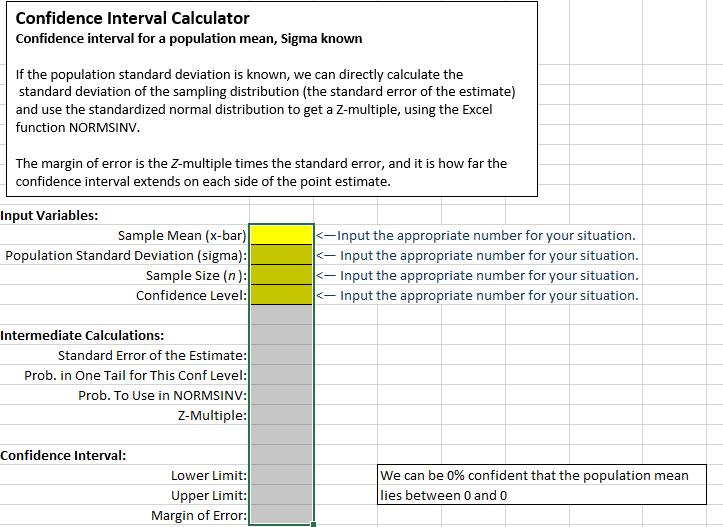
Confidence Interval Calculator Confidence interval for a population mean, Sigma known If the population standard deviation is known, we can directly calculate the standard deviation of the sampling distribution (the standard error of the estimate) and use the standardized normal distribution to get a Z-multiple, using the Excel function NORMSINV. The margin of error is the Z-multiple times the standard error, and it is how far the confidence interval extends on each side of the point estimate. Input Variables: Sample Mean (x-bar) Population Standard Deviation (sigma): Sample Size (n): Confidence Level: Intermediate Calculations: Standard Error of the Estimate: Prob. in One Tail for This Conf Level: Prob. To Use in NORMSINV: Z-Multiple: Confidence Interval: Lower Limit: Upper Limit: Margin of Error:
Step by Step Solution
There are 3 Steps involved in it
Practical Application Scenario 1 Refer to the stock you selected in Module 1 Using the same stock you need to analyze the data based on the scenario b... View full answer

Get step-by-step solutions from verified subject matter experts