

Question: . For this assignment you will use the financial statements and Excel template provided in Canvas (each section of ACCTG 231 is assigned a different
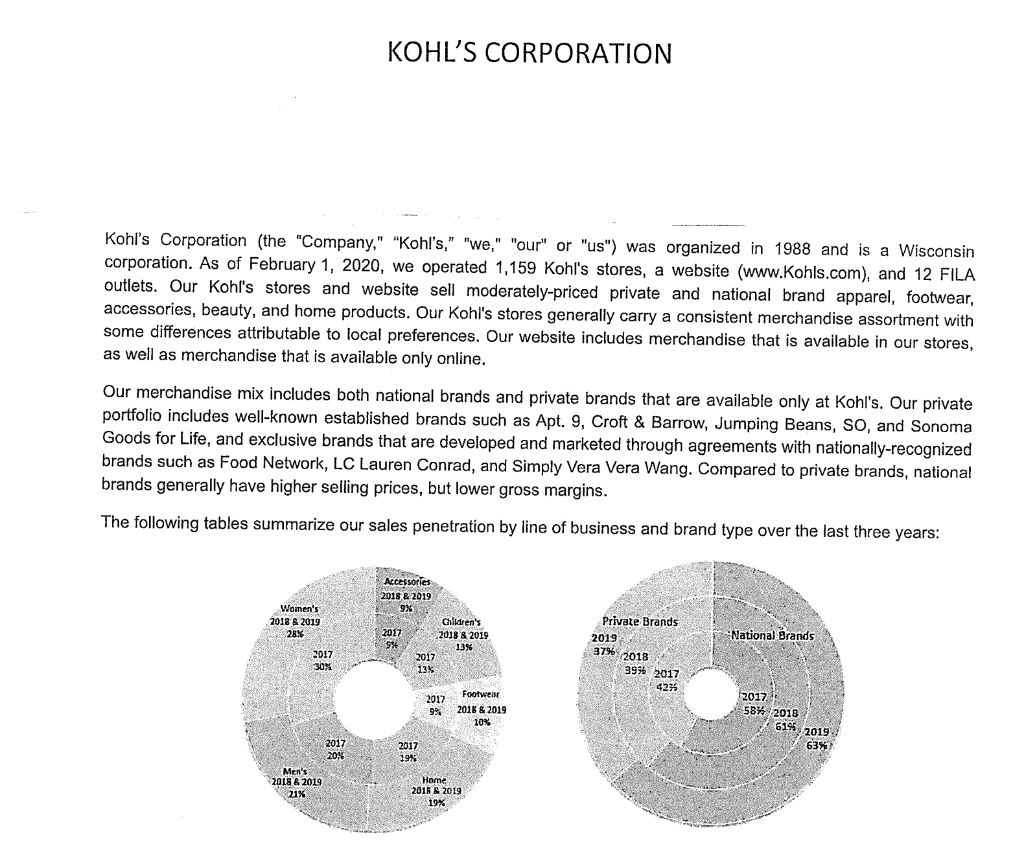
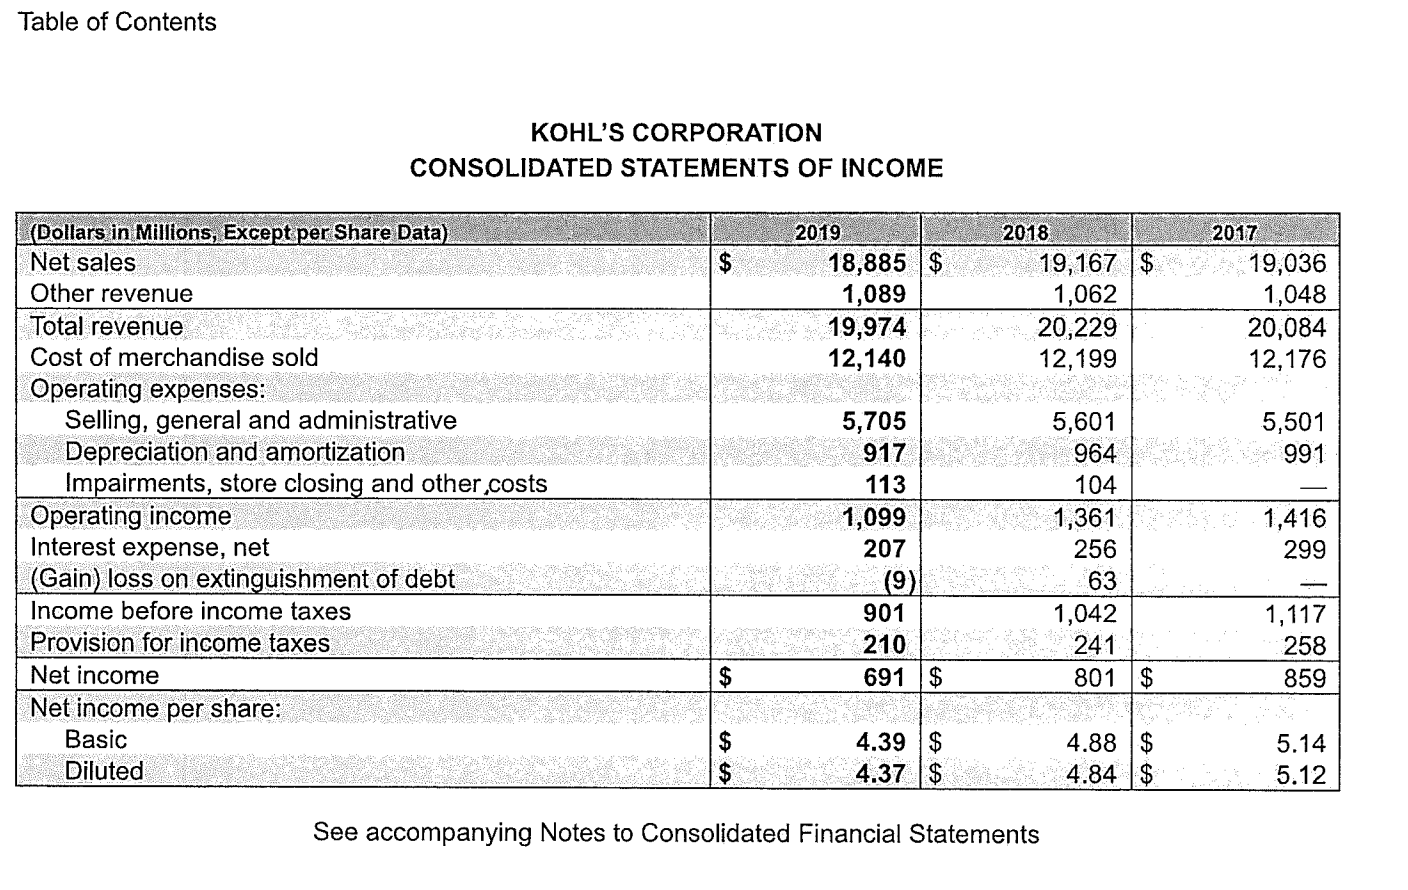
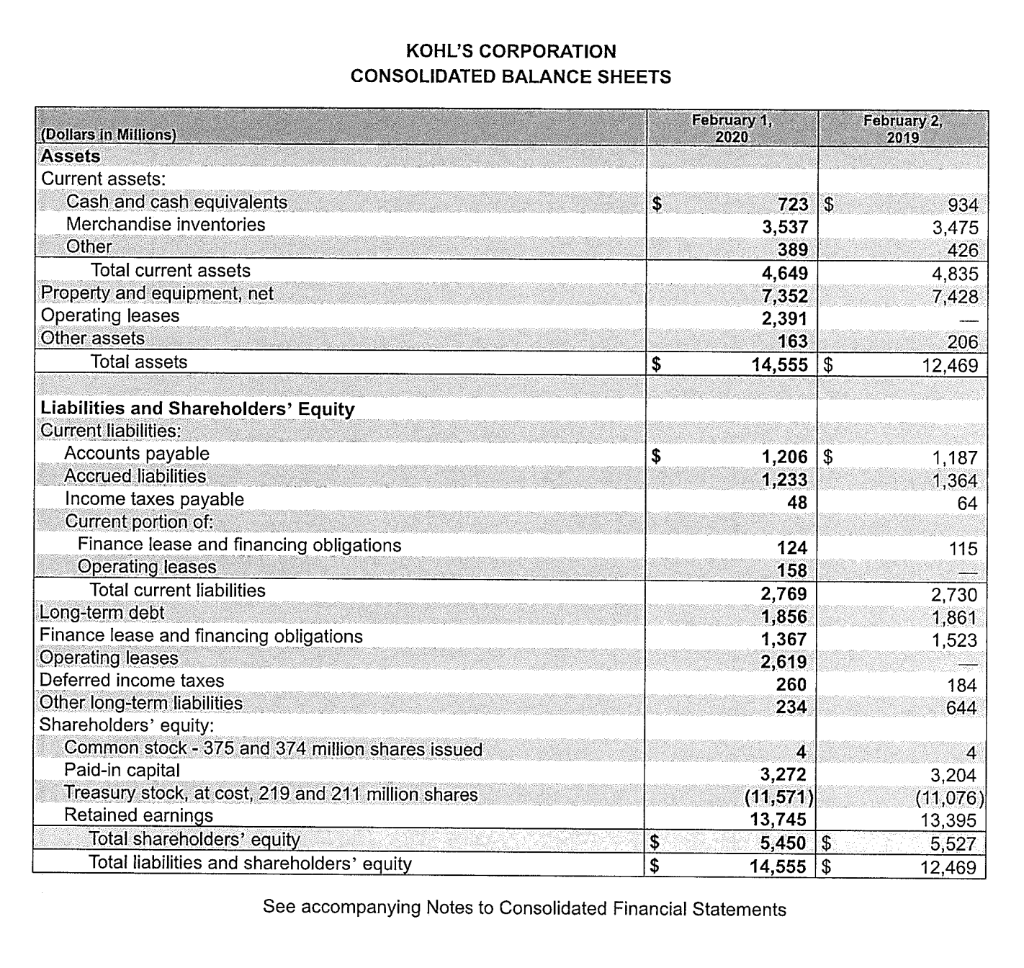
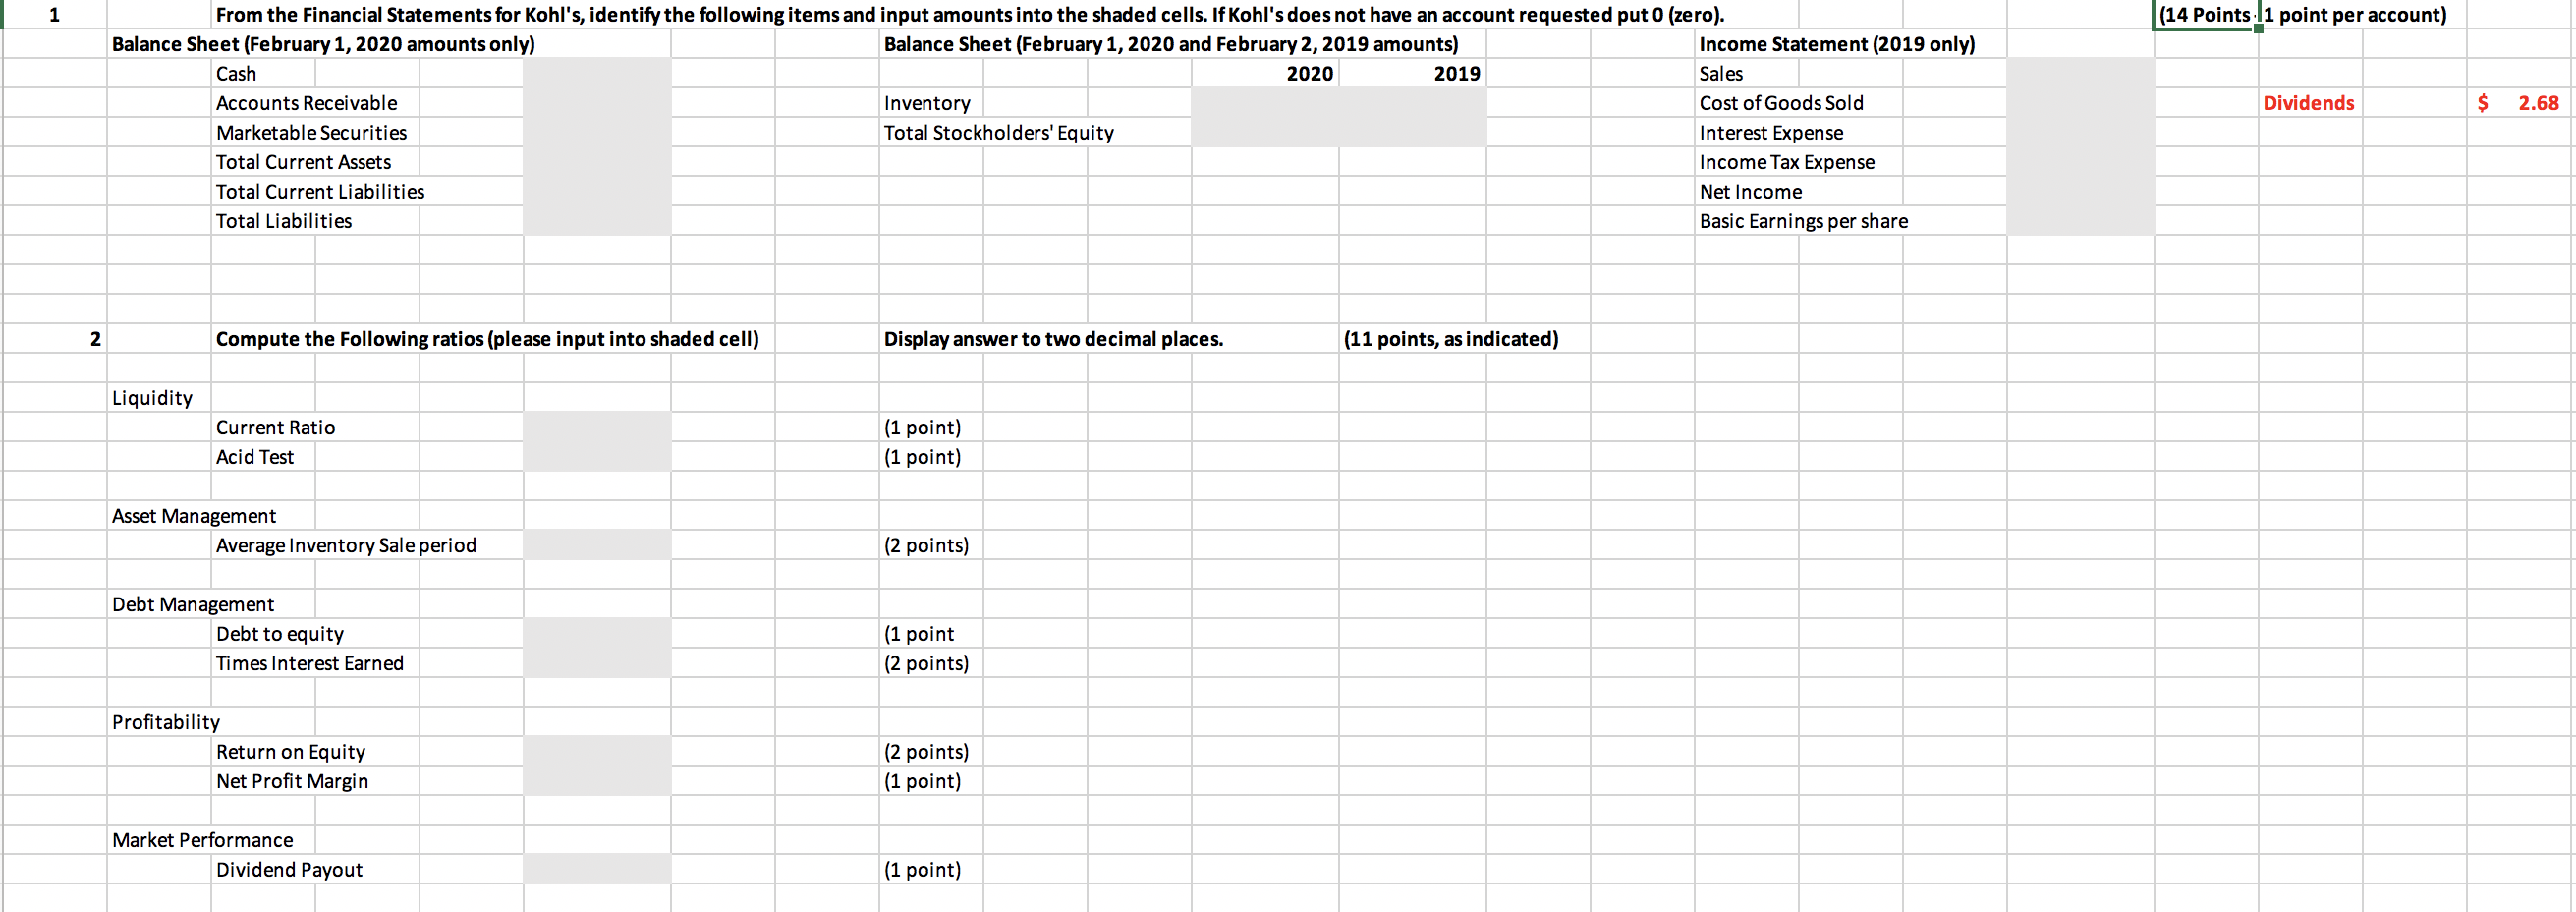
. For this assignment you will use the financial statements and Excel template provided in Canvas (each section of ACCTG 231 is assigned a different company) to: Find the financial statement amounts requested and enter them into the Excel spreadsheet template (NOTE: an amount for dividends has already been entered in the data section of the spreadsheet). (14 points) Compute the ratios requested in the Excel template. (11 points) . 0 A couple of notes: The financial statements uploaded to Canvas for this assignment are not necessarily the most recent for each company, as years were explicitly chosen to insure a positive net income and existence of a few key items. Also, ratios presented online may differ from those you compute as websites may adjust formulas and/or omit items from some calculations (i.e. some ratios have a few variations with regard to alternative calculations). . Points for this assignment will be based on: Using amounts from the specific financial statements provided Computing ratios using the specific formulas in Chapter 14 (a summary of the Chapter 14 formulas is in Exhibit 14-6 in the text) - present all computations to two decimal places. KOHL'S CORPORATION Kohl's Corporation (the "Company," "Kohl's," "we," "our" or "us") was organized in 1988 and is a Wisconsin corporation. As of February 1, 2020, we operated 1,159 Kohl's stores, a website (www.Kohls.com), and 12 FILA outlets. Our Kohl's stores and website sell moderately-priced private and national brand apparel, footwear, accessories, beauty, and home products. Our Kohl's stores generally carry a consistent merchandise assortment with some differences attributable to local preferences. Our website includes merchandise that is available in our stores, as well as merchandise that is available only online. Our merchandise mix includes both national brands and private brands that are available only at Kohl's. Our private portfolio includes well-known established brands such as Apt. 9, Croft & Barrow, Jumping Beans, So, and Sonoma Goods for Life, and exclusive brands that are developed and marketed through agreements with nationally-recognized brands such as Food Network, LC Lauren Conrad, and Simply Vera Vera Wang. Compared to private brands, national brands generally have higher selling prices, but lower gross margins. The following tables summarize our sales penetration by line of business and brand type over the last three years: Women's 2018 & 2019 28% Accessories 2018 & 2019 9X Children's 2017 2018 & 2019 54 13% 2017 13% National Brands 2017 30% Private Brands 2019 3796 19. 2018 3956 2017 425 2017 2017 9% Footwear 2018 & 2019 10% 586 2015 614 2019 2017 195 63%) 2017 20% Men's 2018 & 2019 21% Home 2015 2019 19% Table of Contents KOHL'S CORPORATION CONSOLIDATED STATEMENTS OF INCOME 2019 18,885 $ 1,089 19,974 12,140 2018 19,167 $ 1,062 20,229 12,199 2017 19,036 1,048 20,084 12,176 5,501 991 (Dollars in Millions, Except per Share Data) Net sales Other revenue Total revenue Cost of merchandise sold Operating expenses: Selling, general and administrative Depreciation and amortization Impairments, store closing and other costs Operating income Interest expense, net (Gain) loss on extinguishment of debt Income before income taxes Provision for income taxes Net income Net income per share: Basic Diluted 5,705 917 113 1,099 207 1,416 5,601 964 104 1,361 256 63 1,042 241 801 $ 299 (9) 901 210 691 $ 1,117 258 859 4.39 $ 4.37 $ 4.88 $ 4.84 $ 5.14 5.12 See accompanying Notes to Consolidated Financial Statements KOHL'S CORPORATION CONSOLIDATED BALANCE SHEETS February 1, 2020 February 2, 2019 (Dollars in Millions) Assets Current assets: Cash and cash equivalents Merchandise inventories Other Total current assets Property and equipment, net Operating leases Other assets Total assets 723 $ 3,537 389 4,649 7,352 2,391 163 14,555 $ 934 3,475 426 4,835 7,428 206 12,469 $ 1,206 $ 1,233 48 1,187 1,364 64 115 Liabilities and Shareholders' Equity Current liabilities: Accounts payable Accrued liabilities Income taxes payable Current portion of: Finance lease and financing obligations Operating leases Total current liabilities Long-term debt Finance lease and financing obligations Operating leases Deferred income taxes Other long-term liabilities Shareholders' equity: Common stock - 375 and 374 million shares issued Paid-in capital Treasury stock, at cost, 219 and 211 million shares Retained earnings Total shareholders' equity Total liabilities and shareholders' equity 124 158 2,769 1,856 1,367 2,619 260 234 2,730 1,861 1,523 184 644 4 3,272 (11,571) 13,745 5,450 $ 14,555 $ 4 3,204 (11,076) 13,395 5,527 12,469 $ $ See accompanying Notes to Consolidated Financial Statements 1 (14 Points 11 point per account) Dividends $ 2.68 From the Financial Statements for Kohl's, identify the following items and input amounts into the shaded cells. If Kohl's does not have an account requested put 0 (zero). Balance Sheet (February 1, 2020 amounts only) Balance Sheet (February 1, 2020 and February 2, 2019 amounts) Income Statement (2019 only) Cash 2020 2019 Sales Accounts Receivable Inventory Cost of Goods Sold Marketable Securities Total Stockholders' Equity Interest Expense Total Current Assets Income Tax Expense Total Current Liabilities Net Income Total Liabilities Basic Earnings per share 2 Compute the following ratios (please input into shaded cell) Display answer to two decimal places. (11 points, as indicated) Liquidity Current Ratio Acid Test (1 point) (1 point) Asset Management Average Inventory Sale period (2 points) Debt Management Debt to equity Times Interest Earned (1 point (2 points) Profitability Return on Equity Net Profit Margin (2 points) (1 point) Market Performance Dividend Payout (1 point)
Step by Step Solution
There are 3 Steps involved in it

Get step-by-step solutions from verified subject matter experts