

Question: For this discussion, you will generate one or more plots of the moment components and moment magnitude as a function of the A cable
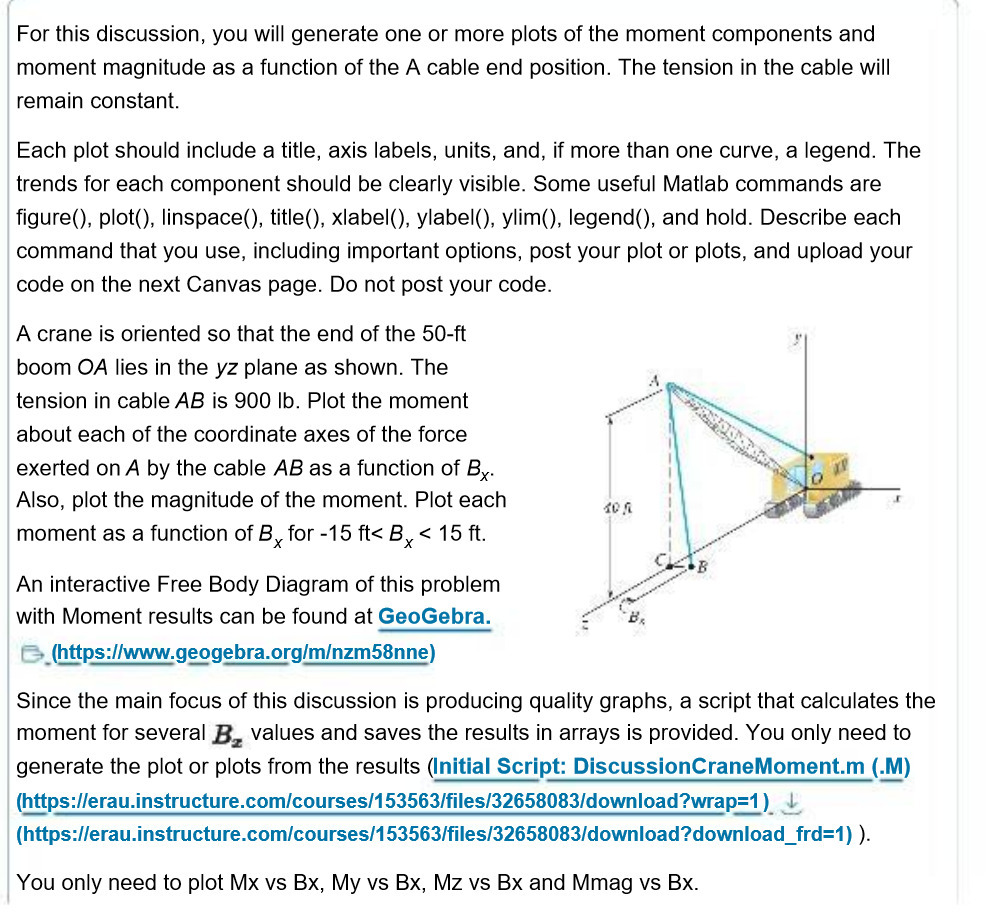
For this discussion, you will generate one or more plots of the moment components and moment magnitude as a function of the A cable end position. The tension in the cable will remain constant. Each plot should include a title, axis labels, units, and, if more than one curve, a legend. The trends for each component should be clearly visible. Some useful Matlab commands are figure(), plot(), linspace(), title(), xlabel(), ylabel(), ylim(), legend(), and hold. Describe each command that you use, including important options, post your plot or plots, and upload your code on the next Canvas page. Do not post your code. A crane is oriented so that the end of the 50-ft boom OA lies in the yz plane as shown. The tension in cable AB is 900 lb. Plot the moment about each of the coordinate axes of the force exerted on A by the cable AB as a function of Bx. Also, plot the magnitude of the moment. Plot each moment as a function of Bx for -15 ft < Bx < 15 ft. An interactive Free Body Diagram of this problem with Moment results can be found at GeoGebra. (https://www.geogebra.org/m/nzm58nne) 10 A Since the main focus of this discussion is producing quality graphs, a script that calculates the moment for several B values and saves the results in arrays is provided. You only need to generate the plot or plots from the results (Initial Script: DiscussionCraneMoment.m (.M) (https://erau.instructure.com/courses/153563/files/32658083/download?wrap=1) (https://erau.instructure.com/courses/153563/files/32658083/download?download_frd=1)). You only need to plot Mx vs Bx, My vs Bx, Mz vs Bx and Mmag vs Bx.
Step by Step Solution
There are 3 Steps involved in it
Solutions clear all close all clc Lao 50 Lac 40 Bx 15115 Tab 900 n lengthBx Mx M... View full answer

Get step-by-step solutions from verified subject matter experts