

Question: For this exercise, we will start to learn a special program designed for developing compartment models. This program (called Berkeley Madonna) provides a highly graphical
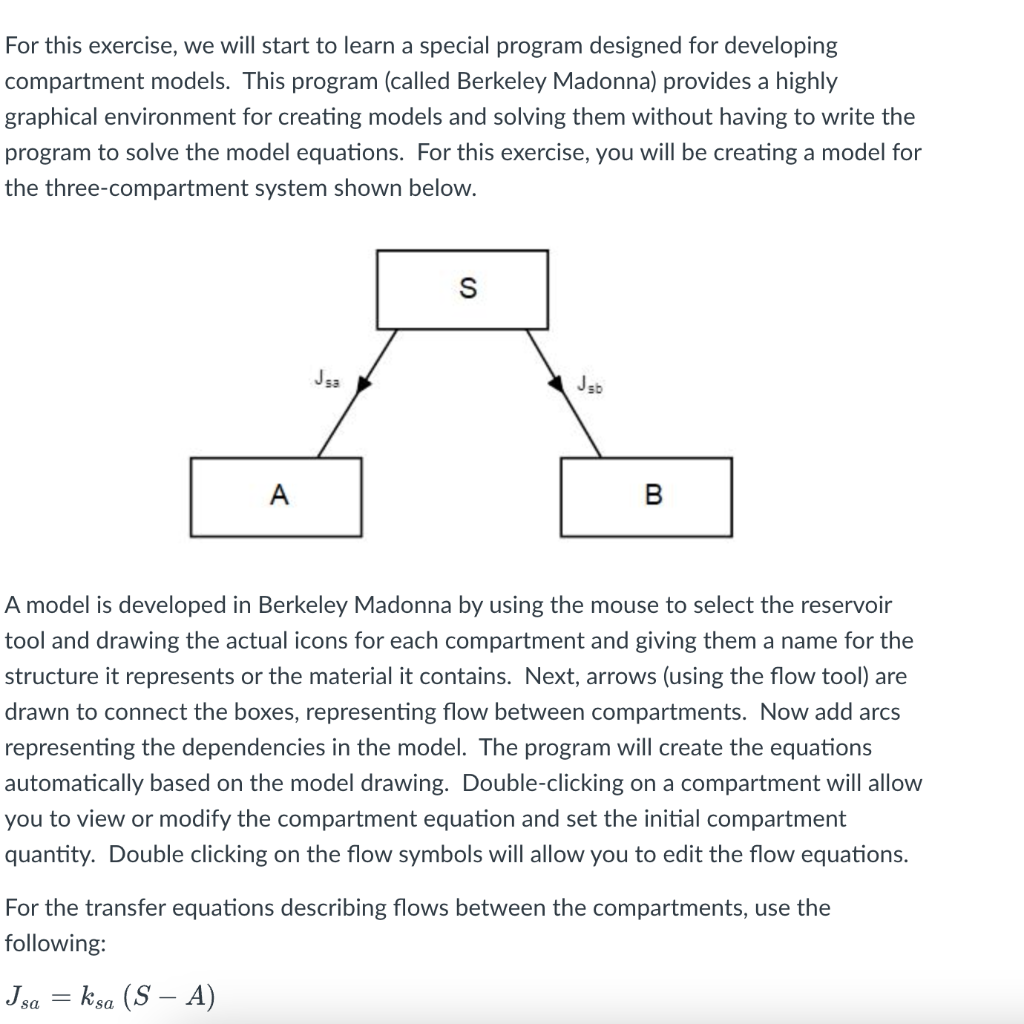
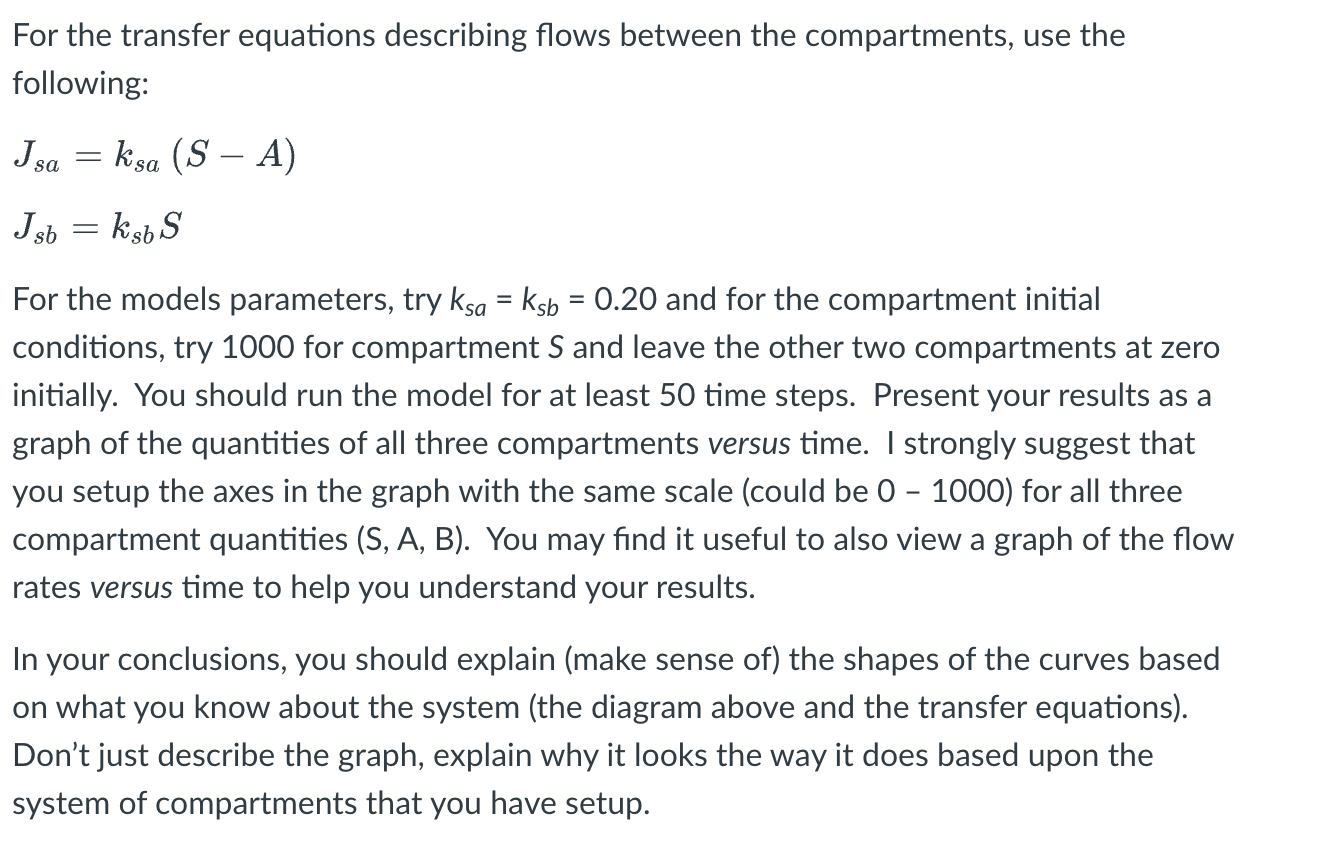
For this exercise, we will start to learn a special program designed for developing compartment models. This program (called Berkeley Madonna) provides a highly graphical environment for creating models and solving them without having to write the program to solve the model equations. For this exercise, you will be creating a model for the three-compartment system shown below. A model is developed in Berkeley Madonna by using the mouse to select the reservoir tool and drawing the actual icons for each compartment and giving them a name for the structure it represents or the material it contains. Next, arrows (using the flow tool) are drawn to connect the boxes, representing flow between compartments. Now add arcs representing the dependencies in the model. The program will create the equations automatically based on the model drawing. Double-clicking on a compartment will allow you to view or modify the compartment equation and set the initial compartment quantity. Double clicking on the flow symbols will allow you to edit the flow equations. For the transfer equations describing flows between the compartments, use the following: Jsa=ksa(SA) For the transfer equations describing flows between the compartments, use the following: Jsa=ksa(SA)Jsb=ksbS For the models parameters, try ksa=ksb=0.20 and for the compartment initial conditions, try 1000 for compartment S and leave the other two compartments at zero initially. You should run the model for at least 50 time steps. Present your results as a graph of the quantities of all three compartments versus time. I strongly suggest that you setup the axes in the graph with the same scale (could be 0 - 1000) for all three compartment quantities (S, A, B). You may find it useful to also view a graph of the flow rates versus time to help you understand your results. In your conclusions, you should explain (make sense of) the shapes of the curves based on what you know about the system (the diagram above and the transfer equations). Don't just describe the graph, explain why it looks the way it does based upon the system of compartments that you have setup
Step by Step Solution
There are 3 Steps involved in it

Get step-by-step solutions from verified subject matter experts