

Question: For this part, use first and second set, i.e. total of 12 Treasuries 4. a)Using regression methods, extract zero coupon bonds. (Note: Force the intercept
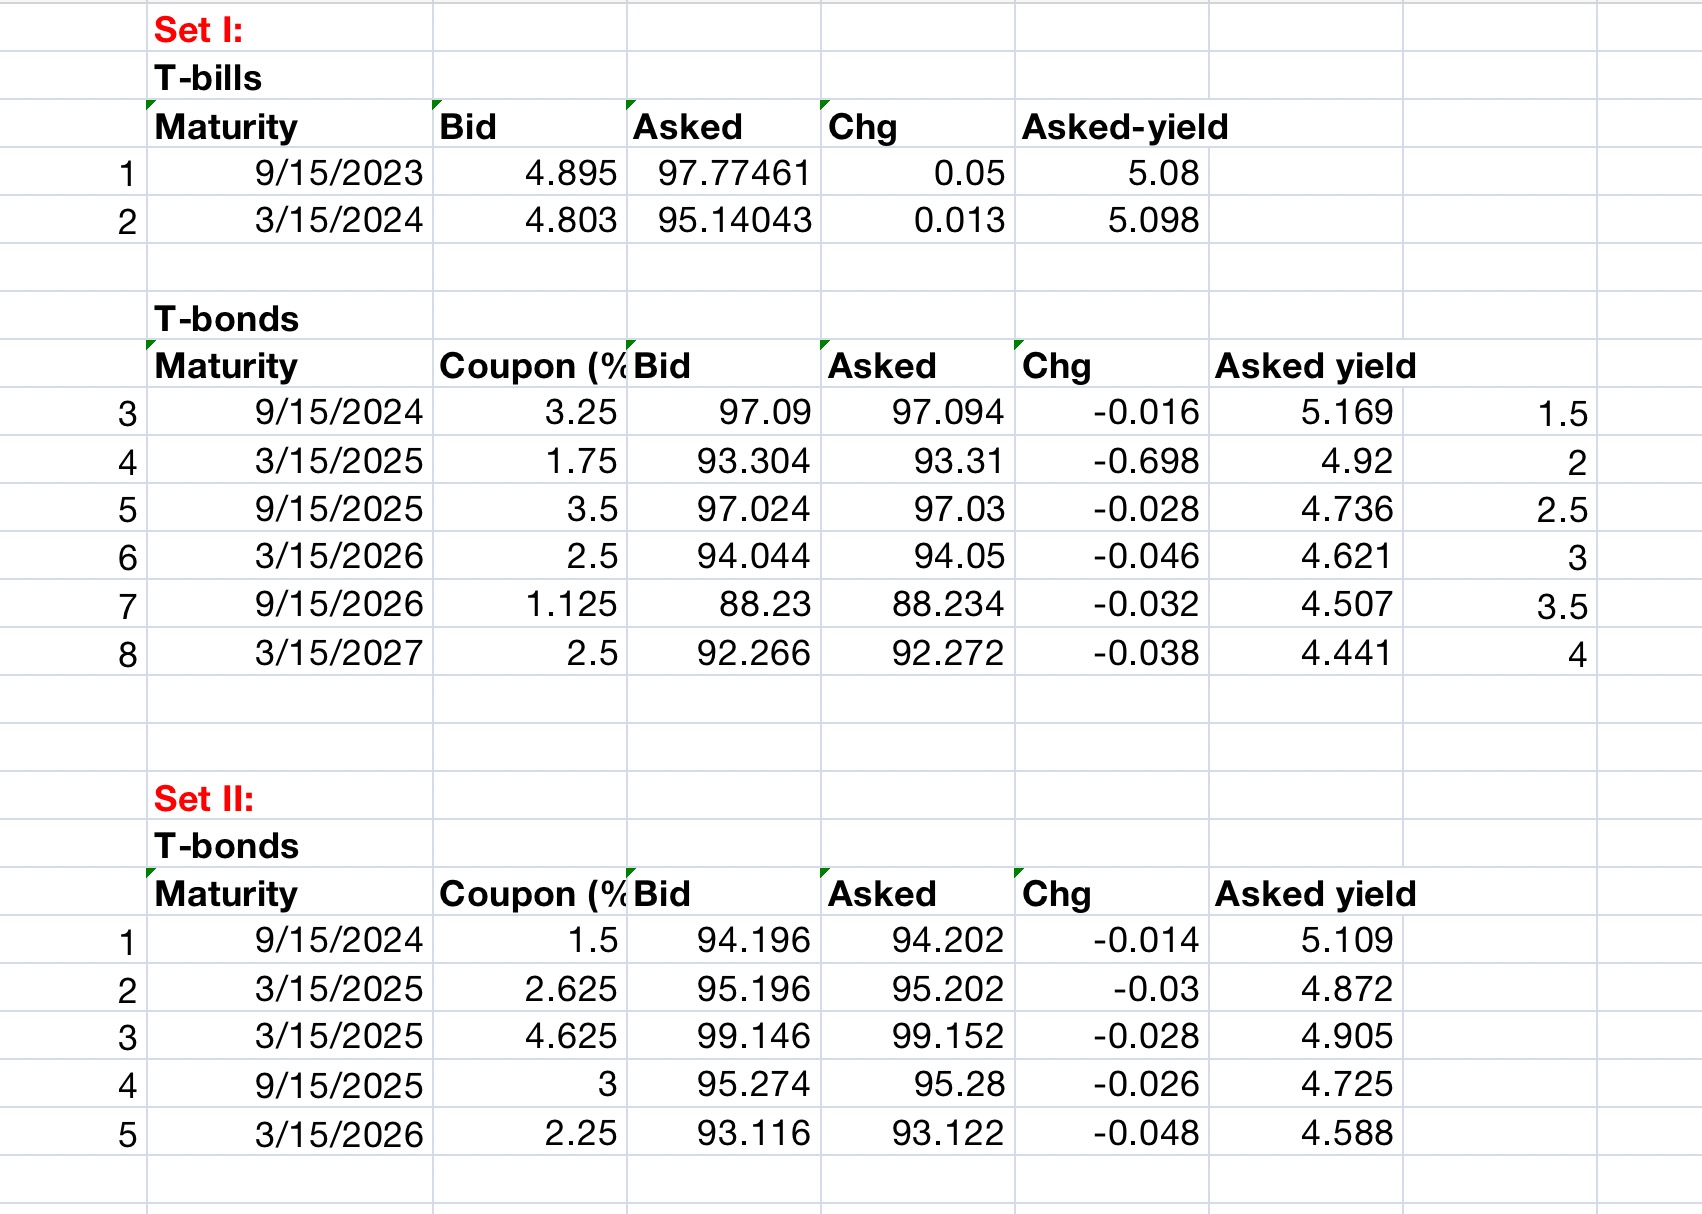
For this part, use first and second set, i.e. total of 12 Treasuries 4.
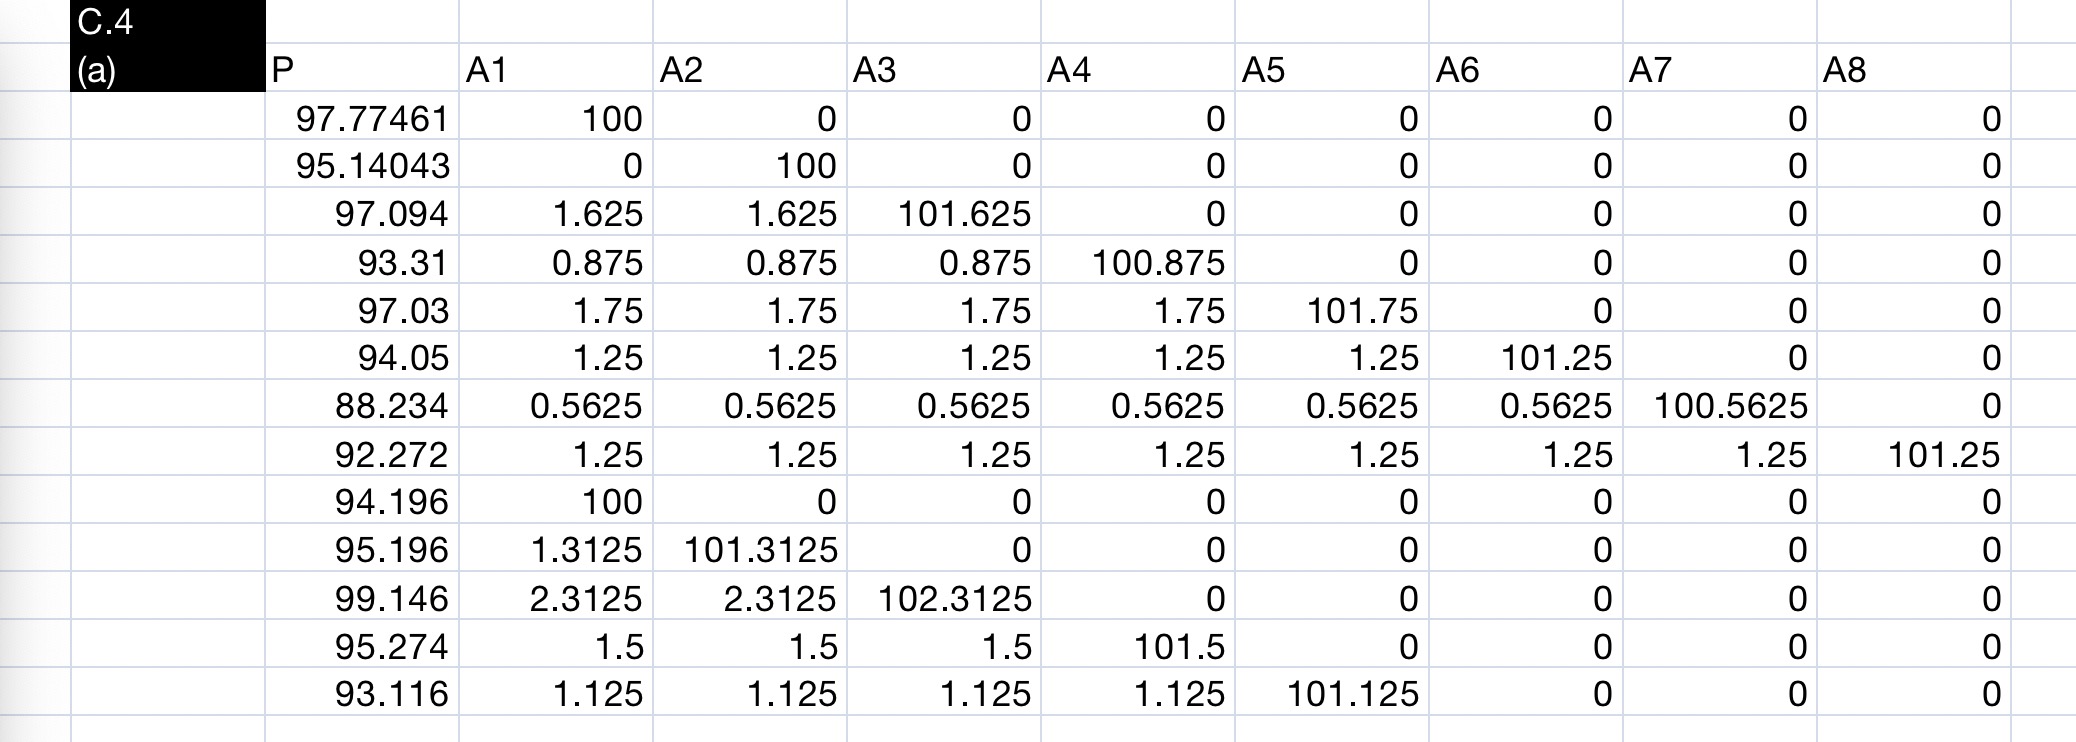
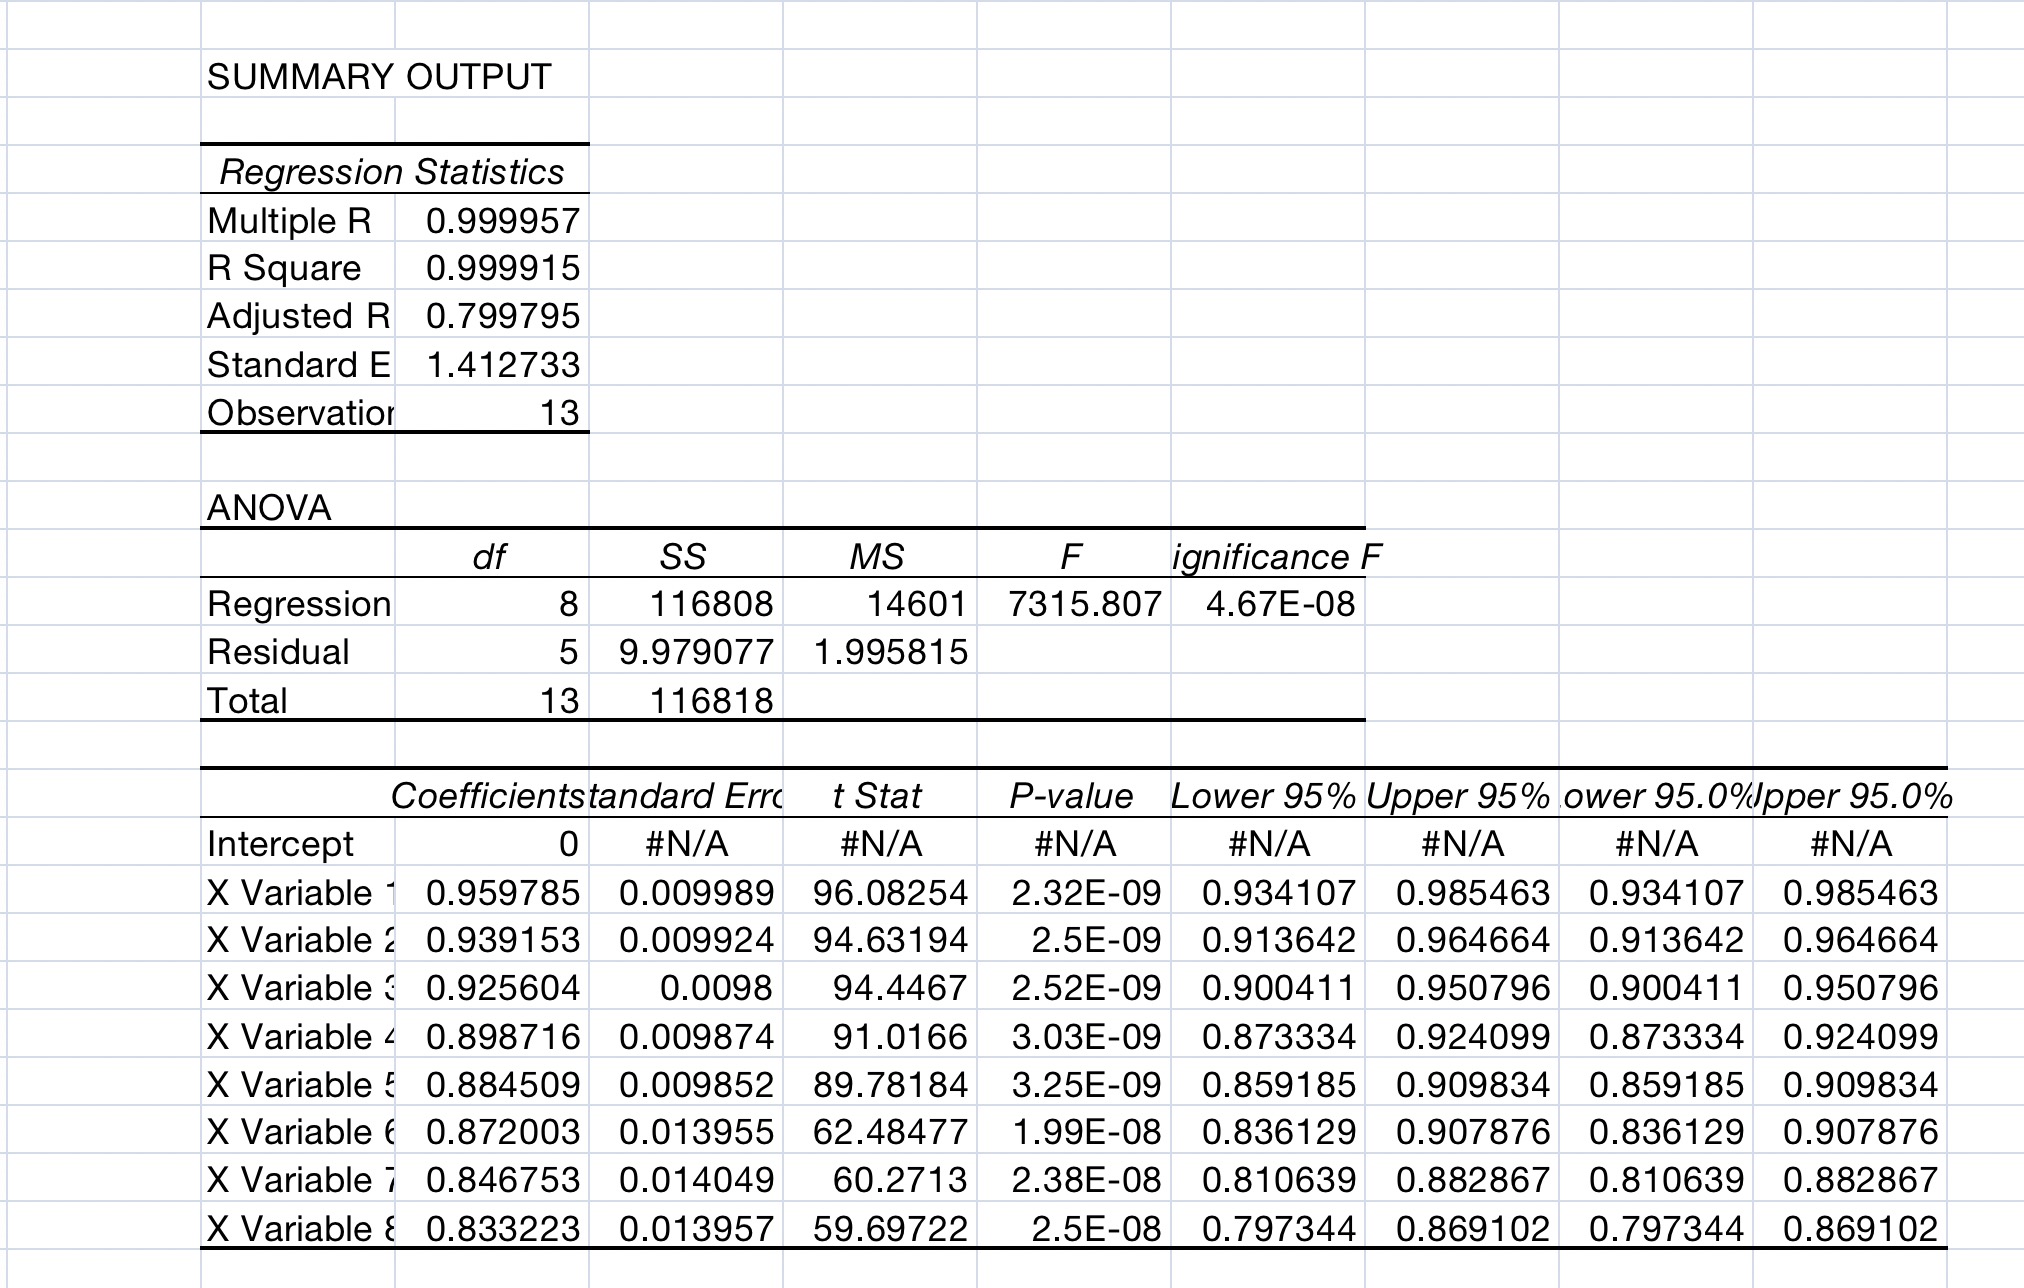
a)Using regression methods, extract zero coupon bonds. (Note: Force the intercept to zero in the regression).
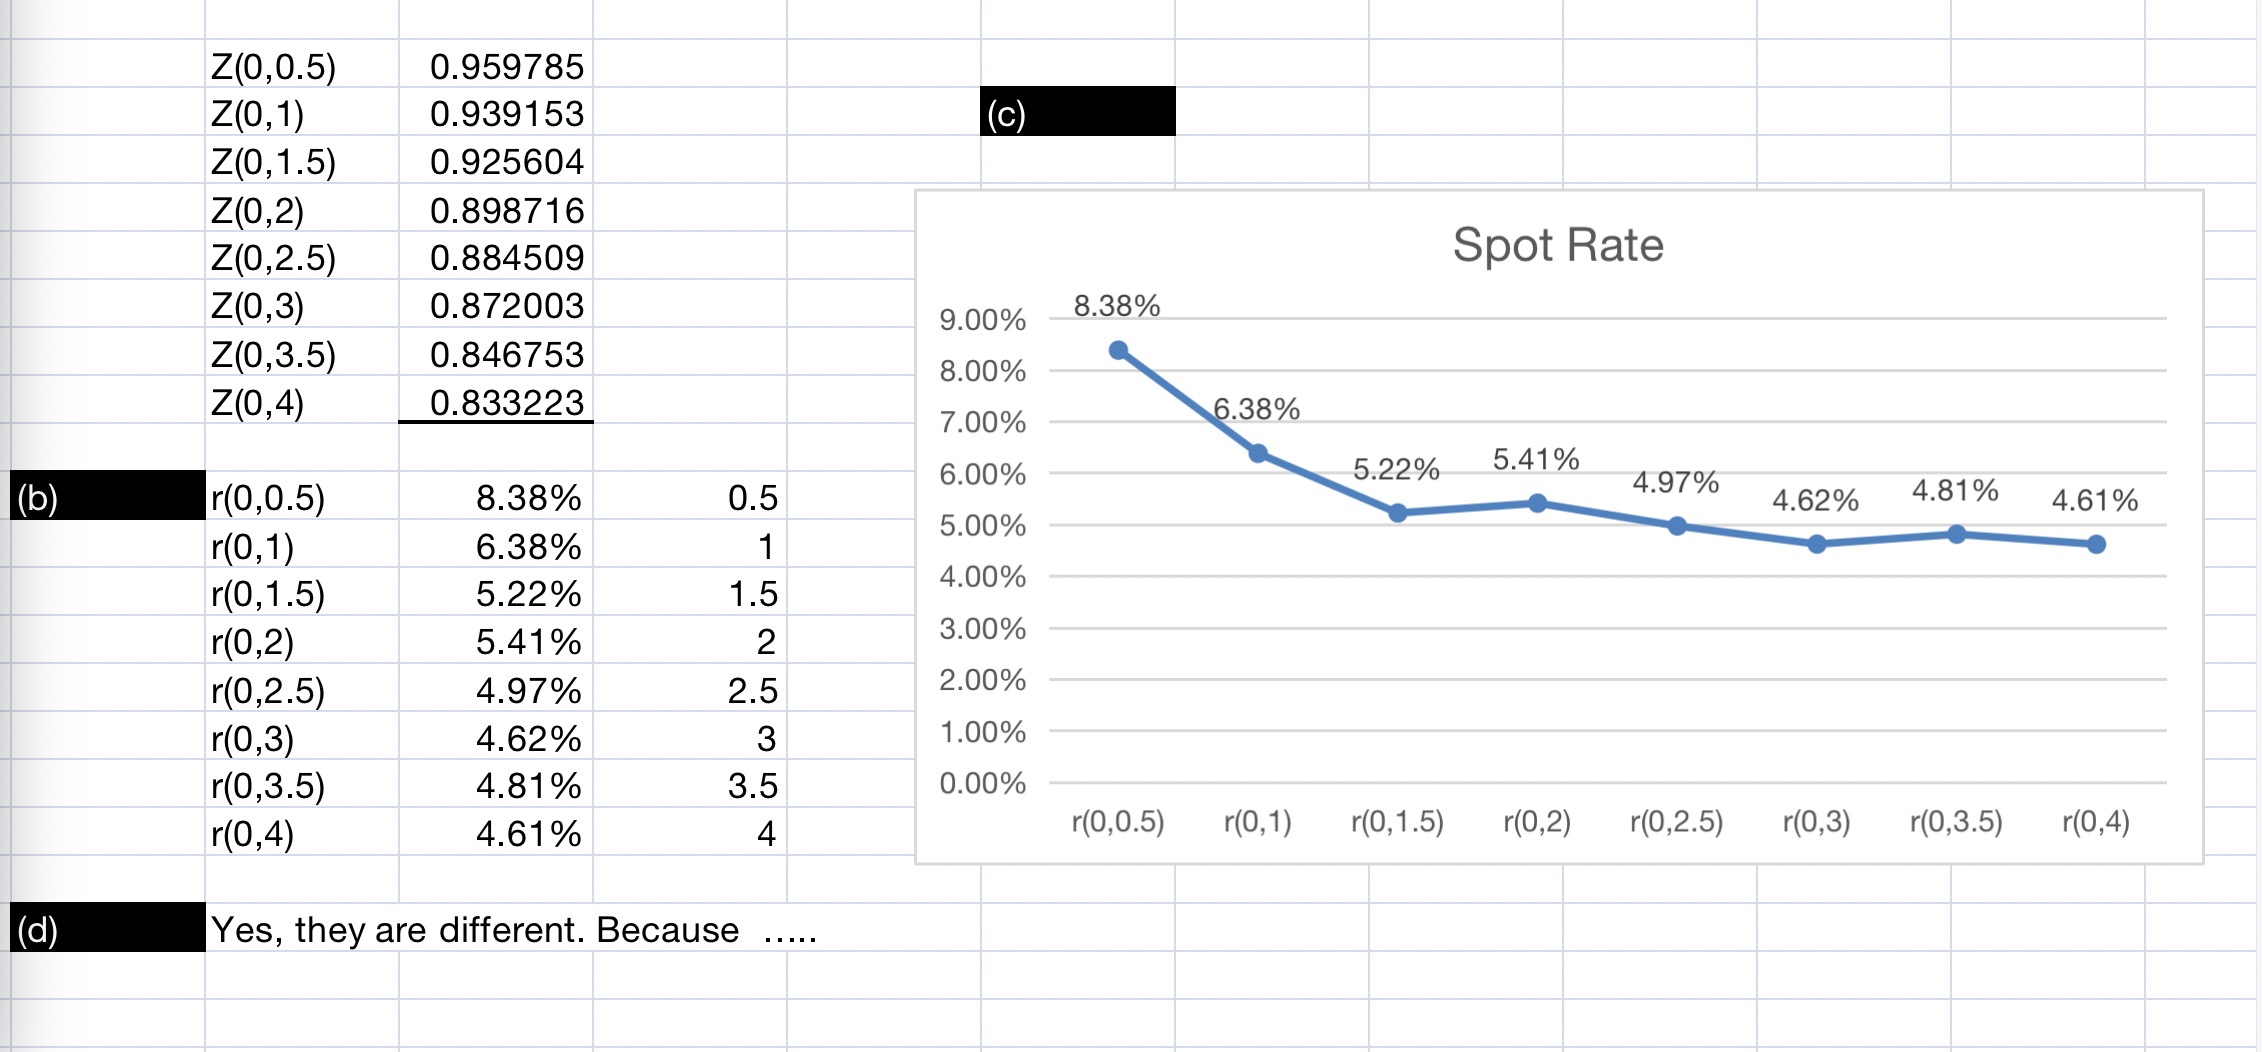
b) Calculate 6 month spot rates
c) Plot the spot rate curve
All the above steps have been completed. See attachedimagesl for details
My question:
d) Compare the spot rates with the ones you found by bootstrapping. Are they different? Why? Why not?
Step by Step Solution
There are 3 Steps involved in it
1 Expert Approved Answer
Step: 1 Unlock

Question Has Been Solved by an Expert!
Get step-by-step solutions from verified subject matter experts
Step: 2 Unlock
Step: 3 Unlock