

Question: For this problem, I suggest you modify the henon_bifurcation_example.m file on the course website rather than starting from scratch. (a) Write a program to draw
![x) for values of the parameter a [2, 4] in increments of](https://dsd5zvtm8ll6.cloudfront.net/si.experts.images/questions/2024/09/66f3ab0fe8251_07166f3ab0f879d9.jpg)
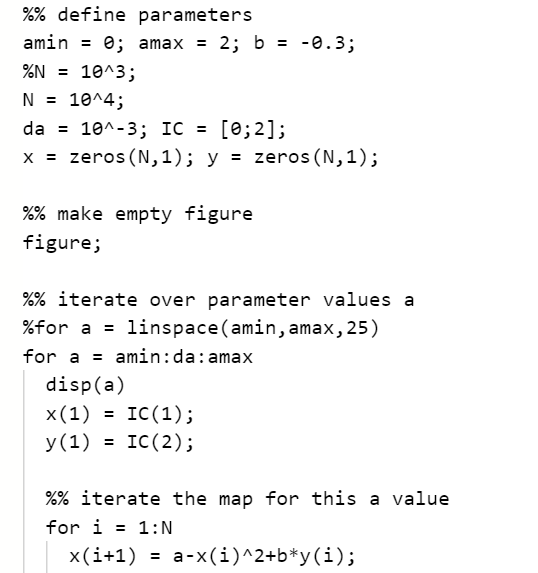
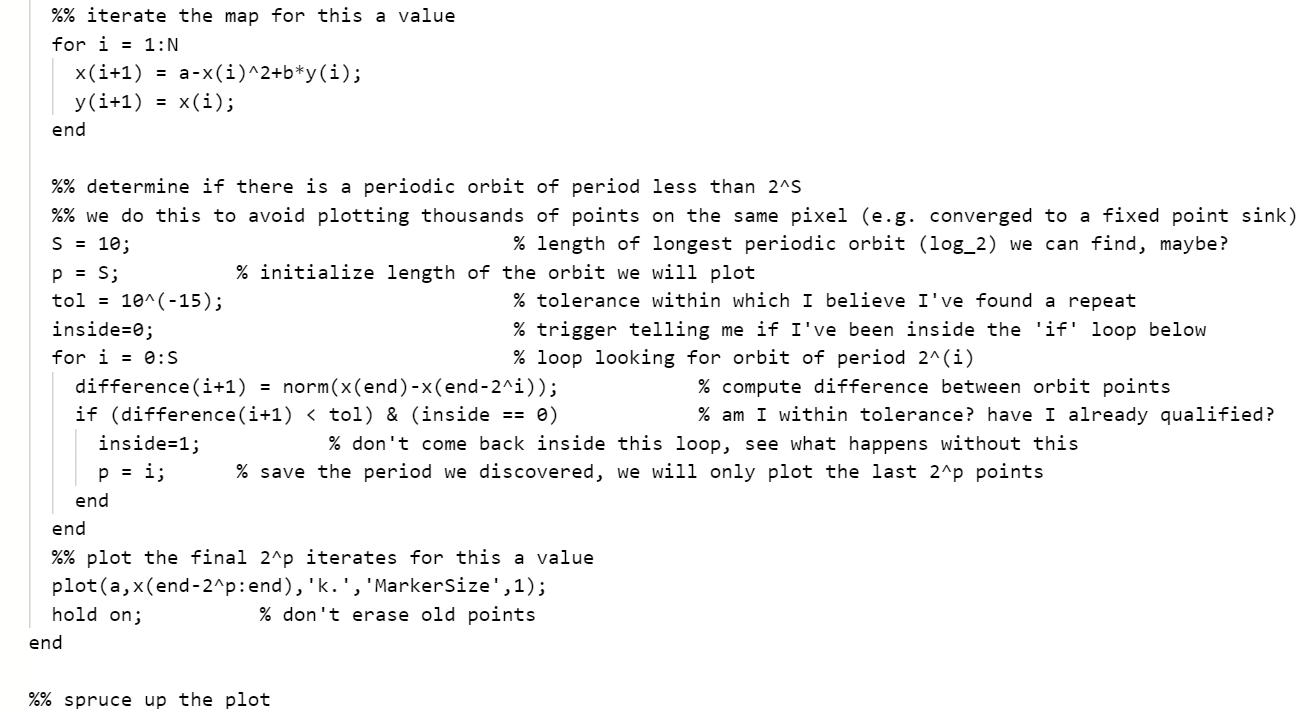
For this problem, I suggest you modify the henon_bifurcation_example.m file on the course website rather than starting from scratch. (a) Write a program to draw the bifurcation diagram for the logistic map 9a(x) = ax(1 x) for values of the parameter a [2, 4] in increments of 0.001. Iterate the map 1000 times starting with a random initial condition co (0,1), you can use the matlab command rand. Plot the bifurcation diagram. (b) Use iterates 101 to 1000 to approximate the Lyapunov exponent for each a. Graph the Lyapunov exponent as a function of the parameter a. In this graph, plot a horizontal line at the origin (the constant function at 0) as a guide to your eye. (c) What do you learn from comparing the two pictures? (d) Why does the Lyapunov exponent appear to bounce off of zero several times before becoming positive? (e) Will a new random initial condition xo produce the same figure? Why or why not? Turn in your code, a single picture with 2 figures (the bifurcation diagram above and the Lyapunov exponent below, both as a function of a), and answers to these questions. %% define parameters amin = 0; amax = 2; b = = -0.3; %N = 10^3; N = 10^4; da = 10^-3; IC = [0;2]; x = zeros (N,1); y = zeros (N, 1); %% make empty figure figure; %% iterate over parameter values a %for a = linspace(amin, amax, 25) for a = amin:da: amax disp(a) x(1) = IC(1); y(1) = IC(2); %% iterate the map for this a value for i = 1:N x(i+1) = a-x(i)^2+b*y(i); %% iterate the map for this a value for i = 1:N x(i+1) = a-x(i)^2+b*y(i); y(i+1) = x(i); end %% determine if there is a periodic orbit of period less than 245 %% we do this to avoid plotting thousands of points on the same pixel (e.g. converged to a fixed point sink) S = 10; % length of longest periodic orbit (log_2) we can find, maybe? p = S; % initialize length of the orbit we will plot tol = 10^(-15); % tolerance within which I believe I've found a repeat inside=0; % trigger telling me if I've been inside the 'if' loop below for i = 0:S % loop looking for orbit of period 2^(i) difference(i+1) = norm(x(end)-x(end-2^i)); % compute difference between orbit points if (difference(i+1)
Step by Step Solution
There are 3 Steps involved in it

Get step-by-step solutions from verified subject matter experts