

Question: For this problem, only compute and interpret MAD, MAE, MAPE. Thank you! 26. The following data were collected during a study of consumer buying patterns:
For this problem, only compute and interpret MAD, MAE, MAPE. Thank you!
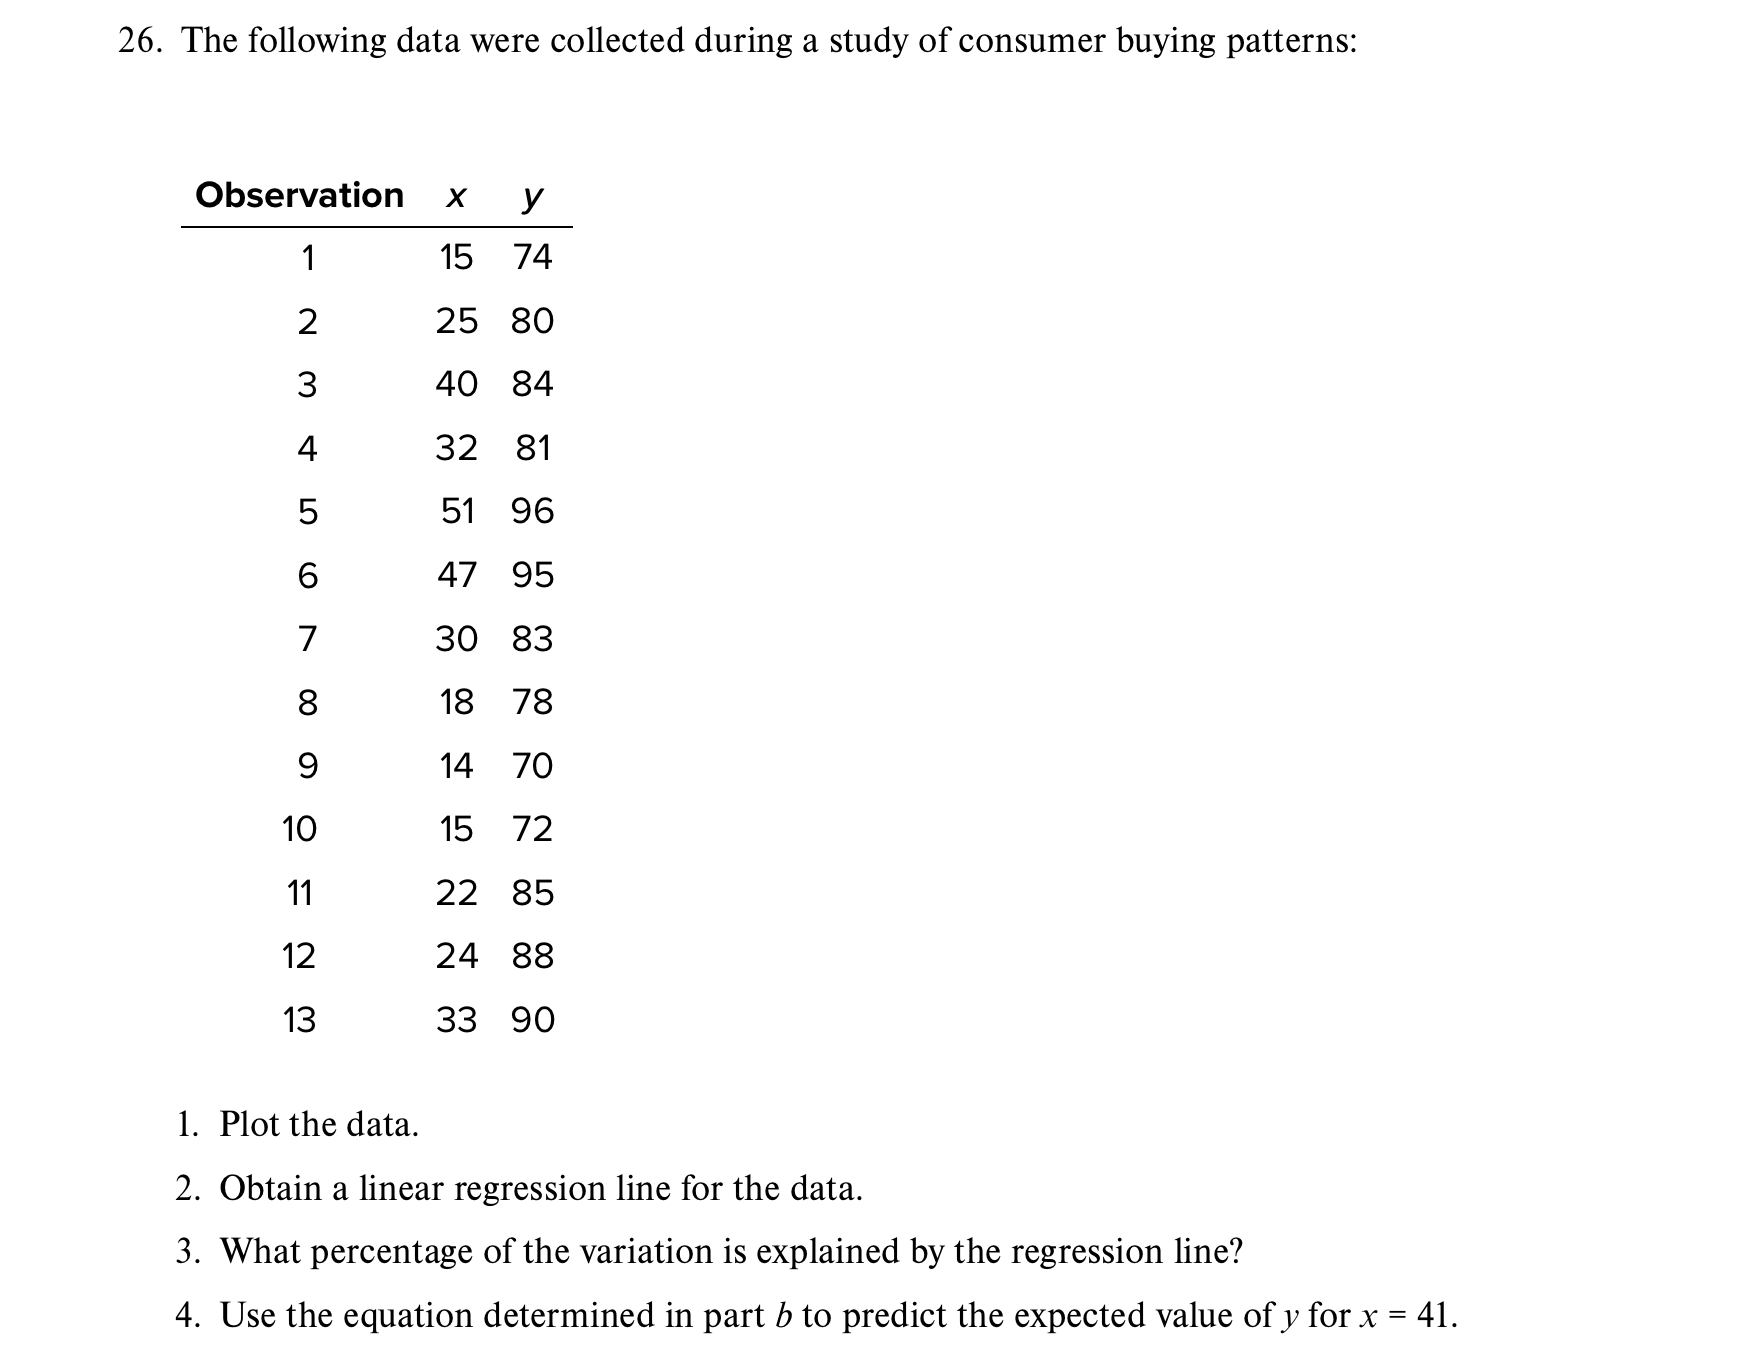
26. The following data were collected during a study of consumer buying patterns: 1. Plot the data. 2. Obtain a linear regression line for the data. 3. What percentage of the variation is explained by the regression line? 4. Use the equation determined in part b to predict the expected value of y for x=41
Step by Step Solution
There are 3 Steps involved in it
1 Expert Approved Answer
Step: 1 Unlock

Question Has Been Solved by an Expert!
Get step-by-step solutions from verified subject matter experts
Step: 2 Unlock
Step: 3 Unlock