

Question: For this problem, we need to make a financial analysis to decide which company to loan the money to. Please use whatever calculations necessary to
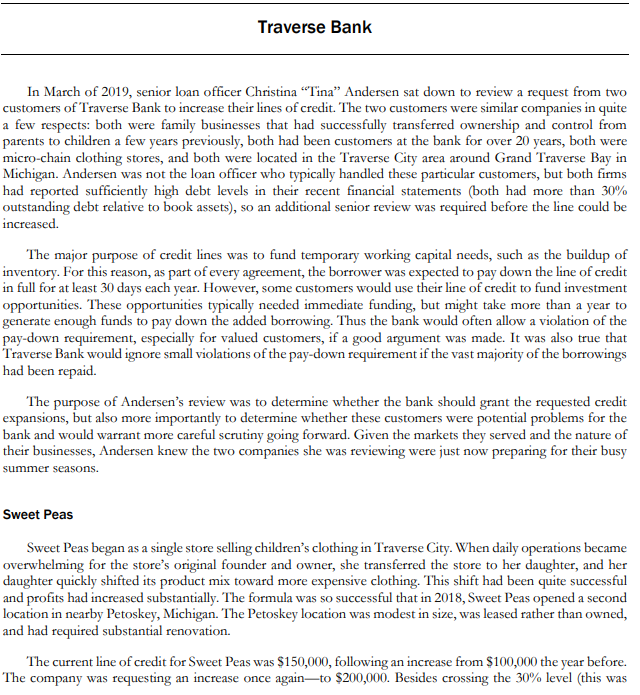
For this problem, we need to make a financial analysis to decide which company to loan the money to. Please use whatever calculations necessary to determine which company would be the best and show said calculations. Can decide to loan money to one, the other, both, or neither. Show whatever you used to come to your conclusion and please explain any of it that is not self explanatory so I can learn what it is that is needed to do for following problems. Thanks for the help and will be sure to upvote immediately when answered!
At the very bottom there will be photos attached of working notes of lots of the work and calculations already computed.
 nknand
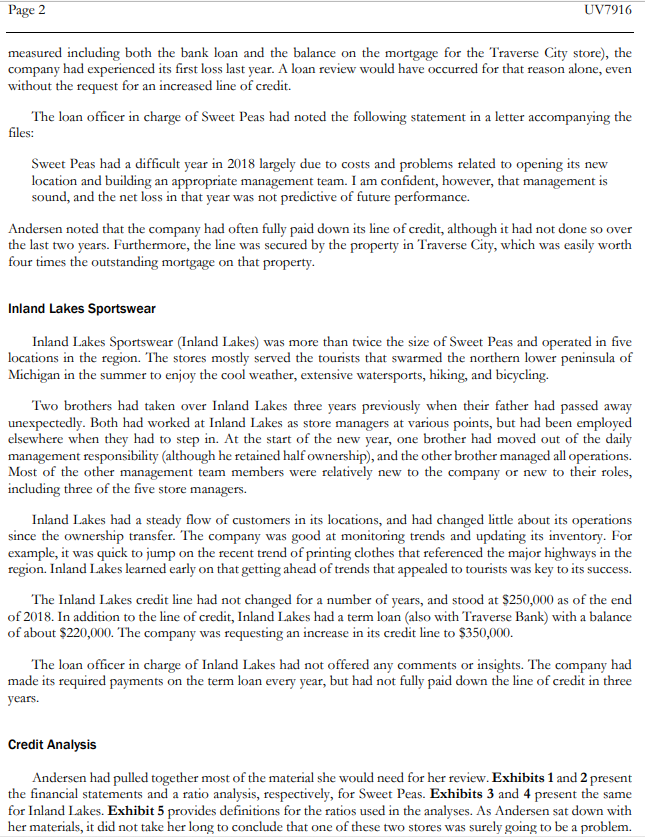
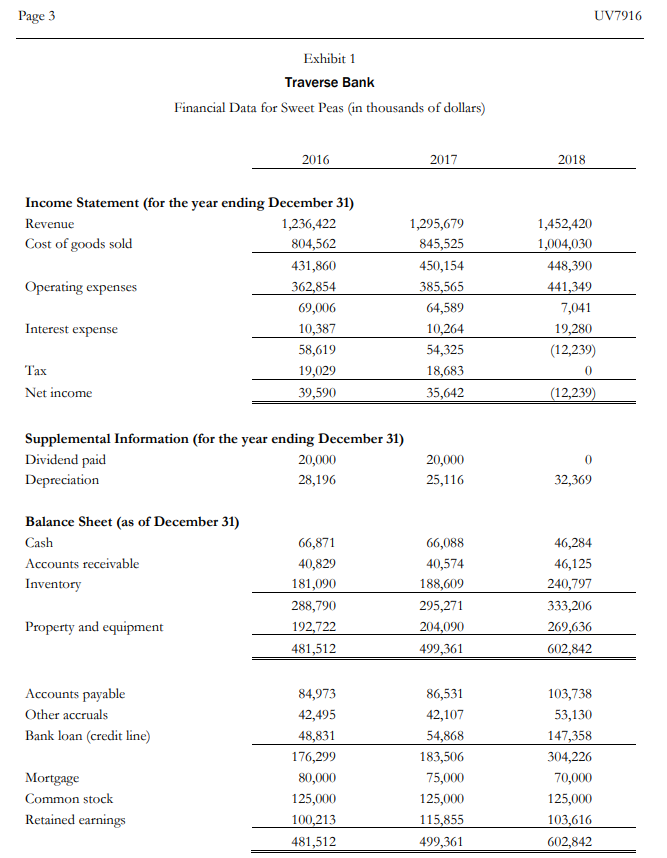
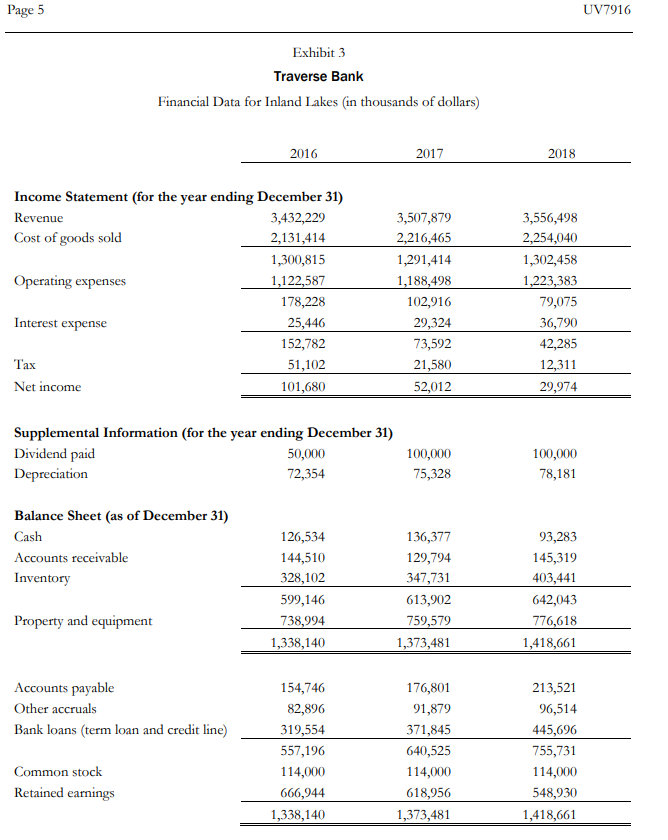
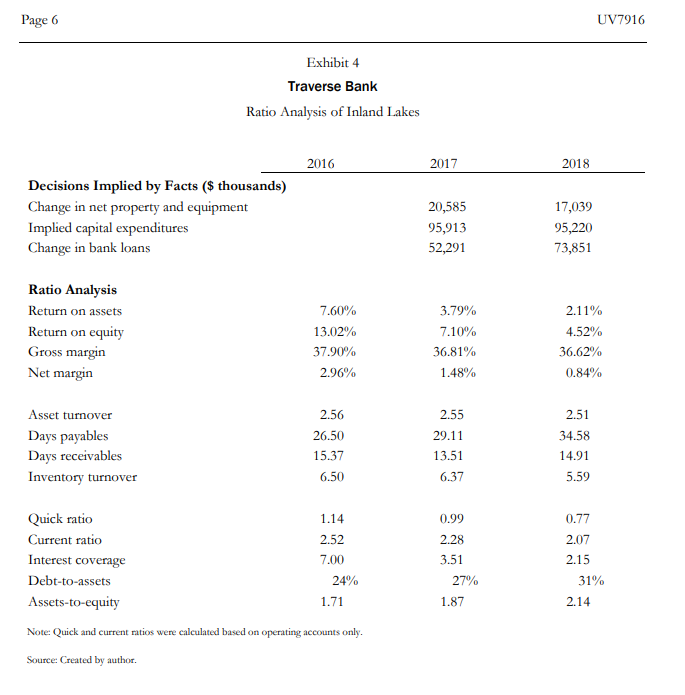
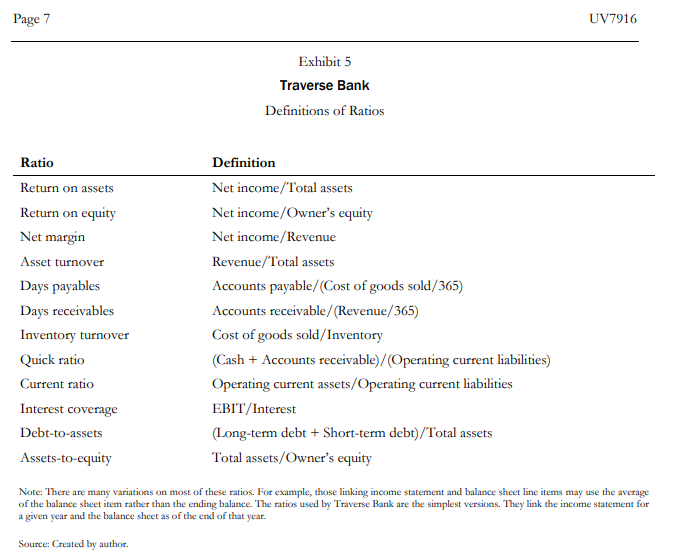
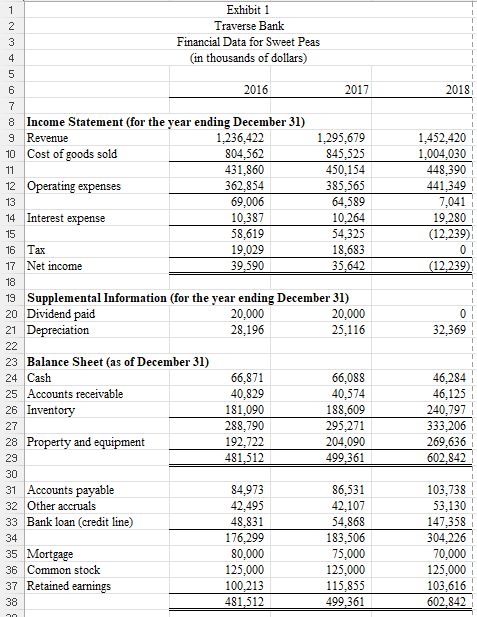
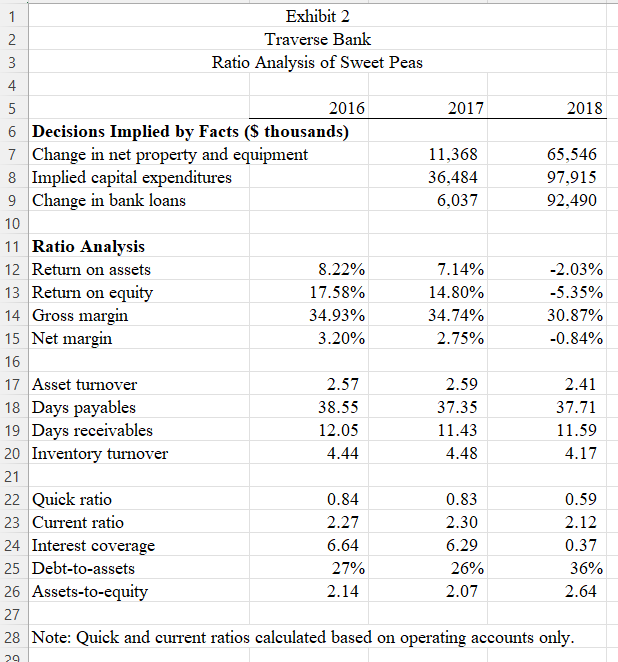
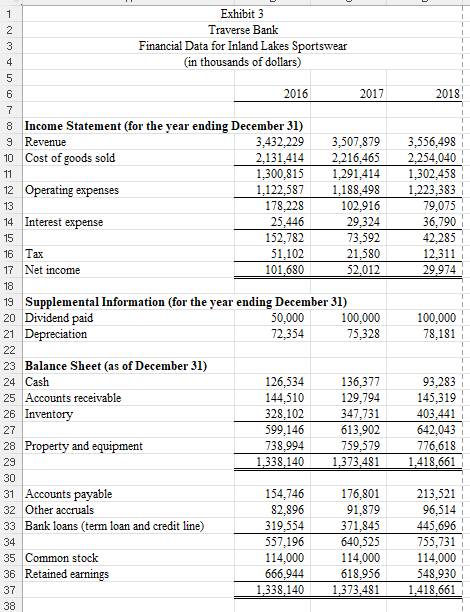
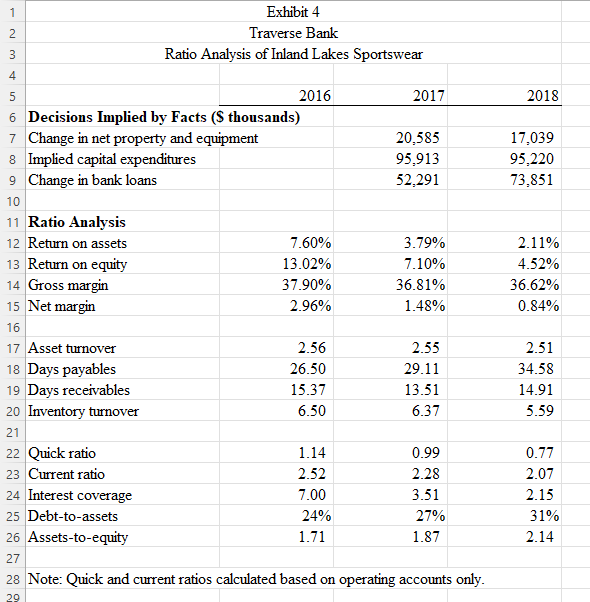
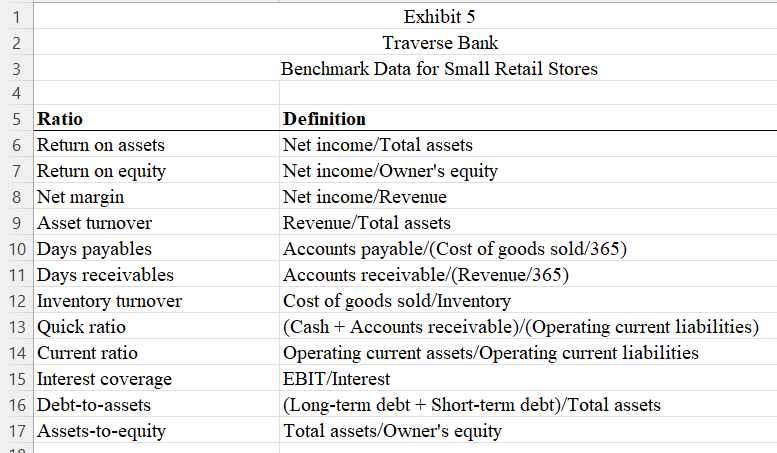
Traverse Bank In March of 2019, senior loan officer Christina Tina Andersen sat down to review a request from two customers of Traverse Bank to increase their lines of credit. The two customers were similar companies in quite a few respects: both were family businesses that had successfully transferred ownership and control from parents to children a few years previously, both had been customers at the bank for over 20 years, both were micro-chain clothing stores, and both were located in the Traverse City area around Grand Traverse Bay in Michigan. Andersen was not the loan officer who typically handled these particular customers, but both firms had reported sufficiently high debt levels in their recent financial statements (both had more than 30% outstanding debt relative to book assets), so an additional senior review was required before the line could be increased. The major purpose of credit lines was to fund temporary working capital needs, such as the buildup of inventory. For this reason, as part of every agreement, the borrower was expected to pay down the line of credit in full for at least 30 days each year. However, some customers would use their line of credit to fund investment opportunities. These opportunities typically needed immediate funding, but might take more than a year to generate enough funds to pay down the added borrowing. Thus the bank would often allow a violation of the pay-down requirement, especially for valued customers, if a good argument was made. It was also true that Traverse Bank would ignore small violations of the pay-down requirement if the vast majority of the borrowings had been repaid. The purpose of Andersen's review was to determine whether the bank should grant the requested credit expansions, but also more importantly to determine whether these customers were potential problems for the bank and would warrant more careful scrutiny going forward. Given the markets they served and the nature of their businesses, Andersen knew the two companies she was reviewing were just now preparing for their busy summer seasons. Sweet Peas Sweet Peas began as a single store selling children's clothing in Traverse City. When daily operations became overwhelming for the store's original founder and owner, she transferred the store to her daughter, and her daughter quickly shifted its product mix toward more expensive clothing. This shift had been quite successful and profits had increased substantially. The formula was so successful that in 2018, Sweet Peas opened a second location in nearby Petoskey, Michigan. The Petoskey location was modest in size, was leased rather than owned, and had required substantial renovation. The current line of credit for Sweet Peas was $150,000, following an increase from $100,000 the year before. The company was requesting an increase once againto $200,000. Besides crossing the 30% level (this was Page 2 UV7916 measured including both the bank loan and the balance on the mortgage for the Traverse City store), the company had experienced its first loss last year. A loan review would have occurred for that reason alone, even without the request for an increased line of credit. The loan officer in charge of Sweet Peas had noted the following statement in a letter accompanying the files: Sweet Peas had a difficult year in 2018 largely due to costs and problems related to opening its new location and building an appropriate management team. I am confident, however, that management is sound, and the net loss in that year was not predictive of future performance. Andersen noted that the company had often fully paid down its line of credit, although it had not done so over the last two years. Furthermore, the line was secured by the property in Traverse City, which was easily worth four times the outstanding mortgage on that property. Inland Lakes Sportswear Inland Lakes Sportswear (Inland Lakes) was more than twice the size of Sweet Peas and operated in five locations in the region. The stores mostly served the tourists that swarmed the northern lower peninsula of Michigan in the summer to enjoy the cool weather, extensive watersports, hiking, and bicycling. Two brothers had taken over Inland Lakes three years previously when their father had passed away unexpectedly. Both had worked at Inland Lakes as store managers at various points, but had been employed elsewhere when they had to step in. At the start of the new year, one brother had moved out of the daily management responsibility (although he retained half ownership), and the other brother managed all operations. Most of the other management team members were relatively new to the company or new to their roles, including three of the five store managers. Inland Lakes had a steady flow of customers in its locations, and had changed little about its operations since the ownership transfer. The company was good at monitoring trends and updating its inventory. For example, it was quick to jump on the recent trend of printing clothes that referenced the major highways in the region. Inland Lakes learned early on that getting ahead of trends that appealed to tourists was key to its success. The Inland Lakes credit line had not changed for a number of years, and stood at $250,000 as of the end of 2018. In addition to the line of credit, Inland Lakes had a term loan (also with Traverse Bank) with a balance of about $220,000. The company was requesting an increase in its credit line to $350,000. The loan officer in charge of Inland Lakes had not offered any comments or insights. The company had made its required payments on the term loan every year, but had not fully paid down the line of credit in three years. Credit Analysis Andersen had pulled together most of the material she would need for her review. Exhibits 1 and 2 present the financial statements and a ratio analysis, respectively, for Sweet Peas. Exhibits 3 and 4 present the same for Inland Lakes. Exhibit 5 provides definitions for the ratios used in the analyses. As Andersen sat down with her materials, it did not take her long to conclude that one of these two stores was surely going to be a problem. Page 3 UV7916 Exhibit 1 Traverse Bank Financial Data for Sweet Peas (in thousands of dollars) 2016 2017 2018 Income Statement (for the year ending December 31) Revenue 1,236,422 Cost of goods sold 804,562 431,860 Operating expenses 362,854 69,006 Interest expense 10,387 58,619 Tax 19,029 Net income 39,590 1,295,679 845,525 450,154 385,565 64,589 10,264 54,325 18,683 35,642 1,452,420 1,004,030 448,390 441,349 7,041 19,280 (12,239) 0 (12,239) Supplemental Information (for the year ending December 31) Dividend paid 20,000 Depreciation 28,196 20,000 25,116 0 32,369 Balance Sheet (as of December 31) Cash Accounts receivable Inventory 66,871 40,829 181,090 288,790 192,722 481,512 66,088 40,574 188,609 295,271 204,090 499,361 46,284 46,125 240,797 333,206 269,636 602,842 Property and equipment Accounts payable Other accruals Bank loan (credit line) 84,973 42,495 48,831 176,299 80,000 125,000 100,213 481,512 86,531 42,107 54,868 183,506 75,000 125,000 115,855 499,361 103,738 53,130 147,358 304,226 70,000 125,000 103,616 602,842 Mortgage Common stock Retained earnings Page 4 UV7916 Exhibit 2 Traverse Bank Ratio Analysis of Sweet Peas 2016 2017 2018 Decisions Implied by Facts ($ thousands) Change in net property and equipment Implied capital expenditures Change in bank loans 11,368 36,484 6,037 65,546 97,915 92,490 Ratio Analysis Return on assets Return on equity Gross margin Net margin 8.22% 17.58% 34.93% 3.20% 7.14% 14.80% 34.74% 2.75% -2.03% -5.35% 30.87% -0.84% 2.57 2.41 Asset turnover Days payables Days receivables Inventory turnover 38.55 12.05 2.59 37.35 11.43 37.71 11.59 4.44 4.48 4.17 Quick ratio 0.84 Current ratio 2.27 Interest coverage 6.64 Debt-to-assets 27% Assets-to-equity 2.14 Note:Quick and current ratios were calculated based on operating accounts only. 0.83 2.30 6.29 26% 2.07 0.59 2.12 0.37 36% 2.64 Source: Created by author. Page 5 UV7916 Exhibit 3 Traverse Bank Financial Data for Inland Lakes (in thousands of dollars) 2016 2017 2018 Income Statement (for the year ending December 31) Revenue 3,432,229 Cost of goods sold 2,131,414 1,300,815 Operating expenses 1,122,587 178,228 Interest expense 25,446 152,782 Tax 51,102 Net income 101,680 3,507,879 2,216,465 1,291,414 1,188,498 102,916 29,324 73,592 21,580 52,012 3,556,498 2,254,040 1,302,458 1,223,383 79,075 36,790 42,285 12,311 29,974 Supplemental Information (for the year ending December 31) Dividend paid 50,000 Depreciation 72,354 100,000 75,328 100,000 78,181 Balance Sheet (as of December 31) Cash Accounts receivable Inventory 126,534 144,510 328,102 599,146 738,994 1,338,14 136,377 129,794 347,731 613,902 759,579 1,373,481 93,283 145,319 403,441 642,043 776,618 1,418,661 Property and equipment Accounts payable Other accruals Bank loans (term loan and credit line) 154,746 82,896 319,554 557,196 114,000 666,944 1,338,140 176,801 91,879 371,845 640,525 114,000 618,956 1,373,481 213,521 96,514 445,696 755,731 114,000 548,930 1,418,661 Common stock Retained earnings Page 6 UV7916 Exhibit 4 Traverse Bank Ratio Analysis of Inland Lakes 2016 2017 2018 Decisions Implied by Facts ($ thousands) Change in net property and equipment Implied capital expenditures Change in bank loans 20,585 95,913 52,291 17,039 95,220 73,851 Ratio Analysis Return on assets Return on equity Gross margin Net margin 7.60% 13.02% 37.90% 2.96% 3.79% 7.10% 36.81% 1.48% 2.11% 4.52% 36.62% 0.84% 2.56 2.55 2.51 26.50 29.11 34.58 Asset turnover Days payables Days receivables Inventory turnover 15.37 13.51 14.91 6.50 6.37 5.59 0.99 Quick ratio 1.14 Current ratio 2.52 Interest coverage 7.00 Debt-to-assets 24% Assets-to-equity 1.71 Note: Quick and current ratios were calculated based on operating accounts only. 2.28 3.51 27% 1.87 0.77 2.07 2.15 31% 2.14 Source: Created by author. Page 7 UV7916 Exhibit 5 Traverse Bank Definitions of Ratios Ratio Return on assets Return on equity Net margin Asset turnover Days payables Days receivables Inventory turnover Quick ratio Current ratio Interest coverage Debt-to-assets Assets-to-equity Definition Net income/Total assets Net income/Owner's equity Net income/Revenue Revenue / Total assets Accounts payable/(Cost of goods sold/365) Accounts receivable/(Revenue/365) Cost of goods sold/Inventory (Cash + Accounts receivable)/(Operating current liabilities) Operating current assets/Operating current liabilities EBIT/Interest (Long-term debt + Short-term debt)/Total assets Total assets/Owner's equity Note: There are many variations on most of these ratios. For example, those linking income statement and balance sheet line items may use the average of the balance sheet item rather than the ending balance. The ratios used by Traverse Bank are the simplest versions. They link the income statement for a given year and the balance sheet as of the end of that year. Source: Created by author 1 2 3 Exhibit 1 Traverse Bank Financial Data for Sweet Peas in thousands of dollars) 4 5 6 2016 2017 2018 7 1,452,420 1,004,030 448,390 441,349 7,041 19,280 (12,239) 0 (12,239) 0 32,369 8 Income Statement (for the year ending December 31) 9 Revenue 1,236,422 1,295,679 10 Cost of goods sold 804,562 845,525 11 431,860 450,154 12 Operating expenses 362,854 385,565 13 69,006 64,589 14 Interest expense 10,387 10,264 15 58,619 54,325 16 Tax 19,029 18,683 17 Net income 39,590 35,642 18 19 Supplemental Information (for the year ending December 31) 20 Dividend paid 20,000 20,000 21 Depreciation 28.196 25,116 22 23 Balance Sheet (as of December 31) 24 Cash 66,871 66,088 25 Accounts receivable 40,829 40,574 26 Inventory 181,090 188,609 27 288,790 295,271 28 Property and equipment 192,722 204,090 29 481,512 499,361 30 31 Accounts payable 84,973 86,531 32 Other accruals 42,495 42,107 33 Bank loan (credit line) 48,831 54,868 34 176,299 183,506 35 Mortgage 80,000 75,000 36 Common stock 125,000 125,000 37 Retained earnings 100,213 115,855 38 481,512 499,361 46.284 46,125 240,797 333,206 269,636 602.842 103,738 53,130 147,358 304,226 70,000 125,000 103,616 602.842 N 1 Exhibit 2 2 Traverse Bank 3 Ratio Analysis of Sweet Peas 4 5 2016 2017 2018 6 Decisions Implied by Facts ($ thousands) 7 Change in net property and equipment 11,368 65,546 8 Implied capital expenditures 36,484 97,915 9 Change in bank loans 6,037 92,490 10 11 Ratio Analysis 12 Return on assets 8.22% 7.14% -2.03% 13 Return on equity 17.58% 14.80% -5.35% 14 Gross margin 34.93% 34.74% 30.87% 15 Net margin 3.20% 2.75% -0.84% 16 17 Asset turnover 2.57 2.59 2.41 18 Days payables 38.55 37.35 37.71 19 Days receivables 12.05 11.43 11.59 20 Inventory turnover 4.44 4.48 4.17 21 22 Quick ratio 0.84 0.83 0.59 23 Current ratio 2.27 2.30 2.12 24 Interest coverage 6.64 6.29 0.37 25 Debt-to-assets 27% 26% 36% 26 Assets-to-equity 2.14 2.07 2.64 27 28 Note: Quick and current ratios calculated based on operating accounts only. 29 1 2 3 4 Exhibit 3 Traverse Bank Financial Data for Inland Lakes Sportswear (in thousands of dollars) 1 5 2018 3,556,498 2,254,040 1,302,458 1,223,383 79,075 36,790 42,285 12,311 29.974 100,000 78,181 6 2016 2017 7 8 Income Statement (for the year ending December 31) 9 Revenue 3,432,229 3,507,879 10 Cost of goods sold 2,131,414 2,216,465 11 1,300,815 1.291,414 12 Operating expenses 1,122,587 1,188,498 13 178,228 102,916 14 Interest expense 25.446 29,324 15 152,782 73,592 16 Tax 51,102 21,580 17 Net income 101,680 52,012 18 19 Supplemental Information (for the year ending December 31) 20 Dividend paid 50,000 100,000 21 Depreciation 72,354 75,328 22 23 Balance Sheet (as of December 31) 24 Cash 126,534 136,377 25 Accounts receivable 144,510 129,794 26 Inventory 328,102 347,731 27 599,146 613,902 28 Property and equipment 738,994 759,579 29 1,338.140 1,373,481 30 31 Accounts payable 154,746 176,801 32 Other accruals 82,896 91,879 33 Bank loans (term loan and credit line) 319,554 371,845 34 557,196 640,525 35 Common stock 114,000 114,000 36 Retained earnings 666,944 618,956 37 1,338.140 1.373,481 38 93,283 145,319 403,441 642,043 776,618 1.418.661 213,521 96,514 445,696 755,731 114,000 548,930 1,418,661 1 2 Exhibit 4 Traverse Bank Ratio Analysis of Inland Lakes Sportswear 3 4 2017 2018 20,585 95.913 52.291 17.039 95,220 73,851 3.79% 7.10% 36.81% 1.48% 2.11% 4.52% 36.62% 0.84% 5 2016 6 Decisions Implied by Facts (S thousands) 7 Change in net property and equipment 8 Implied capital expenditures 9 Change in bank loans 10 11 Ratio Analysis 12 Return on assets 7.60% 13 Return on equity 13.02% 14 Gross margin 37.90% 15 Net margin 2.96% 16 17 Asset turnover 2.56 18 Days payables 26.50 19 Days receivables 15.37 20 Inventory turnover 6.50 21 22 Quick ratio 1.14 23 Current ratio 2.52 24 Interest coverage 7.00 25 Debt-to-assets 24% 26 Assets-to-equity 1.71 2.55 29.11 13.51 6.37 2.51 34.58 14.91 5.59 0.99 2.28 3.51 27% 1.87 0.77 2.07 2.15 31% 2.14 27 28 Note: Quick and current ratios calculated based on operating accounts only. 29 1 Exhibit 5 Traverse Bank Benchmark Data for Small Retail Stores 2 3 4 5 Ratio 6 Return on assets 7 Return on equity 8 Net margin 9 Asset turnover 10 Days payables 11 Days receivables 12 Inventory turnover 13 Quick ratio 14 Current ratio 15 Interest coverage 16 Debt-to-assets 17 Assets-to-equity Definition Net income/Total assets Net income/Owner's equity Net income/Revenue Revenue/Total assets Accounts payable (Cost of goods sold/365) Accounts receivable/(Revenue/365) Cost of goods sold/Inventory (Cash + Accounts receivable)/(Operating current liabilities) Operating current assets/Operating current liabilities EBIT/Interest (Long-term debt + Short-term debt)/Total assets Total assets/Owner's equity 10 Traverse Bank In March of 2019, senior loan officer Christina Tina Andersen sat down to review a request from two customers of Traverse Bank to increase their lines of credit. The two customers were similar companies in quite a few respects: both were family businesses that had successfully transferred ownership and control from parents to children a few years previously, both had been customers at the bank for over 20 years, both were micro-chain clothing stores, and both were located in the Traverse City area around Grand Traverse Bay in Michigan. Andersen was not the loan officer who typically handled these particular customers, but both firms had reported sufficiently high debt levels in their recent financial statements (both had more than 30% outstanding debt relative to book assets), so an additional senior review was required before the line could be increased. The major purpose of credit lines was to fund temporary working capital needs, such as the buildup of inventory. For this reason, as part of every agreement, the borrower was expected to pay down the line of credit in full for at least 30 days each year. However, some customers would use their line of credit to fund investment opportunities. These opportunities typically needed immediate funding, but might take more than a year to generate enough funds to pay down the added borrowing. Thus the bank would often allow a violation of the pay-down requirement, especially for valued customers, if a good argument was made. It was also true that Traverse Bank would ignore small violations of the pay-down requirement if the vast majority of the borrowings had been repaid. The purpose of Andersen's review was to determine whether the bank should grant the requested credit expansions, but also more importantly to determine whether these customers were potential problems for the bank and would warrant more careful scrutiny going forward. Given the markets they served and the nature of their businesses, Andersen knew the two companies she was reviewing were just now preparing for their busy summer seasons. Sweet Peas Sweet Peas began as a single store selling children's clothing in Traverse City. When daily operations became overwhelming for the store's original founder and owner, she transferred the store to her daughter, and her daughter quickly shifted its product mix toward more expensive clothing. This shift had been quite successful and profits had increased substantially. The formula was so successful that in 2018, Sweet Peas opened a second location in nearby Petoskey, Michigan. The Petoskey location was modest in size, was leased rather than owned, and had required substantial renovation. The current line of credit for Sweet Peas was $150,000, following an increase from $100,000 the year before. The company was requesting an increase once againto $200,000. Besides crossing the 30% level (this was Page 2 UV7916 measured including both the bank loan and the balance on the mortgage for the Traverse City store), the company had experienced its first loss last year. A loan review would have occurred for that reason alone, even without the request for an increased line of credit. The loan officer in charge of Sweet Peas had noted the following statement in a letter accompanying the files: Sweet Peas had a difficult year in 2018 largely due to costs and problems related to opening its new location and building an appropriate management team. I am confident, however, that management is sound, and the net loss in that year was not predictive of future performance. Andersen noted that the company had often fully paid down its line of credit, although it had not done so over the last two years. Furthermore, the line was secured by the property in Traverse City, which was easily worth four times the outstanding mortgage on that property. Inland Lakes Sportswear Inland Lakes Sportswear (Inland Lakes) was more than twice the size of Sweet Peas and operated in five locations in the region. The stores mostly served the tourists that swarmed the northern lower peninsula of Michigan in the summer to enjoy the cool weather, extensive watersports, hiking, and bicycling. Two brothers had taken over Inland Lakes three years previously when their father had passed away unexpectedly. Both had worked at Inland Lakes as store managers at various points, but had been employed elsewhere when they had to step in. At the start of the new year, one brother had moved out of the daily management responsibility (although he retained half ownership), and the other brother managed all operations. Most of the other management team members were relatively new to the company or new to their roles, including three of the five store managers. Inland Lakes had a steady flow of customers in its locations, and had changed little about its operations since the ownership transfer. The company was good at monitoring trends and updating its inventory. For example, it was quick to jump on the recent trend of printing clothes that referenced the major highways in the region. Inland Lakes learned early on that getting ahead of trends that appealed to tourists was key to its success. The Inland Lakes credit line had not changed for a number of years, and stood at $250,000 as of the end of 2018. In addition to the line of credit, Inland Lakes had a term loan (also with Traverse Bank) with a balance of about $220,000. The company was requesting an increase in its credit line to $350,000. The loan officer in charge of Inland Lakes had not offered any comments or insights. The company had made its required payments on the term loan every year, but had not fully paid down the line of credit in three years. Credit Analysis Andersen had pulled together most of the material she would need for her review. Exhibits 1 and 2 present the financial statements and a ratio analysis, respectively, for Sweet Peas. Exhibits 3 and 4 present the same for Inland Lakes. Exhibit 5 provides definitions for the ratios used in the analyses. As Andersen sat down with her materials, it did not take her long to conclude that one of these two stores was surely going to be a problem. Page 3 UV7916 Exhibit 1 Traverse Bank Financial Data for Sweet Peas (in thousands of dollars) 2016 2017 2018 Income Statement (for the year ending December 31) Revenue 1,236,422 Cost of goods sold 804,562 431,860 Operating expenses 362,854 69,006 Interest expense 10,387 58,619 Tax 19,029 Net income 39,590 1,295,679 845,525 450,154 385,565 64,589 10,264 54,325 18,683 35,642 1,452,420 1,004,030 448,390 441,349 7,041 19,280 (12,239) 0 (12,239) Supplemental Information (for the year ending December 31) Dividend paid 20,000 Depreciation 28,196 20,000 25,116 0 32,369 Balance Sheet (as of December 31) Cash Accounts receivable Inventory 66,871 40,829 181,090 288,790 192,722 481,512 66,088 40,574 188,609 295,271 204,090 499,361 46,284 46,125 240,797 333,206 269,636 602,842 Property and equipment Accounts payable Other accruals Bank loan (credit line) 84,973 42,495 48,831 176,299 80,000 125,000 100,213 481,512 86,531 42,107 54,868 183,506 75,000 125,000 115,855 499,361 103,738 53,130 147,358 304,226 70,000 125,000 103,616 602,842 Mortgage Common stock Retained earnings Page 4 UV7916 Exhibit 2 Traverse Bank Ratio Analysis of Sweet Peas 2016 2017 2018 Decisions Implied by Facts ($ thousands) Change in net property and equipment Implied capital expenditures Change in bank loans 11,368 36,484 6,037 65,546 97,915 92,490 Ratio Analysis Return on assets Return on equity Gross margin Net margin 8.22% 17.58% 34.93% 3.20% 7.14% 14.80% 34.74% 2.75% -2.03% -5.35% 30.87% -0.84% 2.57 2.41 Asset turnover Days payables Days receivables Inventory turnover 38.55 12.05 2.59 37.35 11.43 37.71 11.59 4.44 4.48 4.17 Quick ratio 0.84 Current ratio 2.27 Interest coverage 6.64 Debt-to-assets 27% Assets-to-equity 2.14 Note:Quick and current ratios were calculated based on operating accounts only. 0.83 2.30 6.29 26% 2.07 0.59 2.12 0.37 36% 2.64 Source: Created by author. Page 5 UV7916 Exhibit 3 Traverse Bank Financial Data for Inland Lakes (in thousands of dollars) 2016 2017 2018 Income Statement (for the year ending December 31) Revenue 3,432,229 Cost of goods sold 2,131,414 1,300,815 Operating expenses 1,122,587 178,228 Interest expense 25,446 152,782 Tax 51,102 Net income 101,680 3,507,879 2,216,465 1,291,414 1,188,498 102,916 29,324 73,592 21,580 52,012 3,556,498 2,254,040 1,302,458 1,223,383 79,075 36,790 42,285 12,311 29,974 Supplemental Information (for the year ending December 31) Dividend paid 50,000 Depreciation 72,354 100,000 75,328 100,000 78,181 Balance Sheet (as of December 31) Cash Accounts receivable Inventory 126,534 144,510 328,102 599,146 738,994 1,338,14 136,377 129,794 347,731 613,902 759,579 1,373,481 93,283 145,319 403,441 642,043 776,618 1,418,661 Property and equipment Accounts payable Other accruals Bank loans (term loan and credit line) 154,746 82,896 319,554 557,196 114,000 666,944 1,338,140 176,801 91,879 371,845 640,525 114,000 618,956 1,373,481 213,521 96,514 445,696 755,731 114,000 548,930 1,418,661 Common stock Retained earnings Page 6 UV7916 Exhibit 4 Traverse Bank Ratio Analysis of Inland Lakes 2016 2017 2018 Decisions Implied by Facts ($ thousands) Change in net property and equipment Implied capital expenditures Change in bank loans 20,585 95,913 52,291 17,039 95,220 73,851 Ratio Analysis Return on assets Return on equity Gross margin Net margin 7.60% 13.02% 37.90% 2.96% 3.79% 7.10% 36.81% 1.48% 2.11% 4.52% 36.62% 0.84% 2.56 2.55 2.51 26.50 29.11 34.58 Asset turnover Days payables Days receivables Inventory turnover 15.37 13.51 14.91 6.50 6.37 5.59 0.99 Quick ratio 1.14 Current ratio 2.52 Interest coverage 7.00 Debt-to-assets 24% Assets-to-equity 1.71 Note: Quick and current ratios were calculated based on operating accounts only. 2.28 3.51 27% 1.87 0.77 2.07 2.15 31% 2.14 Source: Created by author. Page 7 UV7916 Exhibit 5 Traverse Bank Definitions of Ratios Ratio Return on assets Return on equity Net margin Asset turnover Days payables Days receivables Inventory turnover Quick ratio Current ratio Interest coverage Debt-to-assets Assets-to-equity Definition Net income/Total assets Net income/Owner's equity Net income/Revenue Revenue / Total assets Accounts payable/(Cost of goods sold/365) Accounts receivable/(Revenue/365) Cost of goods sold/Inventory (Cash + Accounts receivable)/(Operating current liabilities) Operating current assets/Operating current liabilities EBIT/Interest (Long-term debt + Short-term debt)/Total assets Total assets/Owner's equity Note: There are many variations on most of these ratios. For example, those linking income statement and balance sheet line items may use the average of the balance sheet item rather than the ending balance. The ratios used by Traverse Bank are the simplest versions. They link the income statement for a given year and the balance sheet as of the end of that year. Source: Created by author 1 2 3 Exhibit 1 Traverse Bank Financial Data for Sweet Peas in thousands of dollars) 4 5 6 2016 2017 2018 7 1,452,420 1,004,030 448,390 441,349 7,041 19,280 (12,239) 0 (12,239) 0 32,369 8 Income Statement (for the year ending December 31) 9 Revenue 1,236,422 1,295,679 10 Cost of goods sold 804,562 845,525 11 431,860 450,154 12 Operating expenses 362,854 385,565 13 69,006 64,589 14 Interest expense 10,387 10,264 15 58,619 54,325 16 Tax 19,029 18,683 17 Net income 39,590 35,642 18 19 Supplemental Information (for the year ending December 31) 20 Dividend paid 20,000 20,000 21 Depreciation 28.196 25,116 22 23 Balance Sheet (as of December 31) 24 Cash 66,871 66,088 25 Accounts receivable 40,829 40,574 26 Inventory 181,090 188,609 27 288,790 295,271 28 Property and equipment 192,722 204,090 29 481,512 499,361 30 31 Accounts payable 84,973 86,531 32 Other accruals 42,495 42,107 33 Bank loan (credit line) 48,831 54,868 34 176,299 183,506 35 Mortgage 80,000 75,000 36 Common stock 125,000 125,000 37 Retained earnings 100,213 115,855 38 481,512 499,361 46.284 46,125 240,797 333,206 269,636 602.842 103,738 53,130 147,358 304,226 70,000 125,000 103,616 602.842 N 1 Exhibit 2 2 Traverse Bank 3 Ratio Analysis of Sweet Peas 4 5 2016 2017 2018 6 Decisions Implied by Facts ($ thousands) 7 Change in net property and equipment 11,368 65,546 8 Implied capital expenditures 36,484 97,915 9 Change in bank loans 6,037 92,490 10 11 Ratio Analysis 12 Return on assets 8.22% 7.14% -2.03% 13 Return on equity 17.58% 14.80% -5.35% 14 Gross margin 34.93% 34.74% 30.87% 15 Net margin 3.20% 2.75% -0.84% 16 17 Asset turnover 2.57 2.59 2.41 18 Days payables 38.55 37.35 37.71 19 Days receivables 12.05 11.43 11.59 20 Inventory turnover 4.44 4.48 4.17 21 22 Quick ratio 0.84 0.83 0.59 23 Current ratio 2.27 2.30 2.12 24 Interest coverage 6.64 6.29 0.37 25 Debt-to-assets 27% 26% 36% 26 Assets-to-equity 2.14 2.07 2.64 27 28 Note: Quick and current ratios calculated based on operating accounts only. 29 1 2 3 4 Exhibit 3 Traverse Bank Financial Data for Inland Lakes Sportswear (in thousands of dollars) 1 5 2018 3,556,498 2,254,040 1,302,458 1,223,383 79,075 36,790 42,285 12,311 29.974 100,000 78,181 6 2016 2017 7 8 Income Statement (for the year ending December 31) 9 Revenue 3,432,229 3,507,879 10 Cost of goods sold 2,131,414 2,216,465 11 1,300,815 1.291,414 12 Operating expenses 1,122,587 1,188,498 13 178,228 102,916 14 Interest expense 25.446 29,324 15 152,782 73,592 16 Tax 51,102 21,580 17 Net income 101,680 52,012 18 19 Supplemental Information (for the year ending December 31) 20 Dividend paid 50,000 100,000 21 Depreciation 72,354 75,328 22 23 Balance Sheet (as of December 31) 24 Cash 126,534 136,377 25 Accounts receivable 144,510 129,794 26 Inventory 328,102 347,731 27 599,146 613,902 28 Property and equipment 738,994 759,579 29 1,338.140 1,373,481 30 31 Accounts payable 154,746 176,801 32 Other accruals 82,896 91,879 33 Bank loans (term loan and credit line) 319,554 371,845 34 557,196 640,525 35 Common stock 114,000 114,000 36 Retained earnings 666,944 618,956 37 1,338.140 1.373,481 38 93,283 145,319 403,441 642,043 776,618 1.418.661 213,521 96,514 445,696 755,731 114,000 548,930 1,418,661 1 2 Exhibit 4 Traverse Bank Ratio Analysis of Inland Lakes Sportswear 3 4 2017 2018 20,585 95.913 52.291 17.039 95,220 73,851 3.79% 7.10% 36.81% 1.48% 2.11% 4.52% 36.62% 0.84% 5 2016 6 Decisions Implied by Facts (S thousands) 7 Change in net property and equipment 8 Implied capital expenditures 9 Change in bank loans 10 11 Ratio Analysis 12 Return on assets 7.60% 13 Return on equity 13.02% 14 Gross margin 37.90% 15 Net margin 2.96% 16 17 Asset turnover 2.56 18 Days payables 26.50 19 Days receivables 15.37 20 Inventory turnover 6.50 21 22 Quick ratio 1.14 23 Current ratio 2.52 24 Interest coverage 7.00 25 Debt-to-assets 24% 26 Assets-to-equity 1.71 2.55 29.11 13.51 6.37 2.51 34.58 14.91 5.59 0.99 2.28 3.51 27% 1.87 0.77 2.07 2.15 31% 2.14 27 28 Note: Quick and current ratios calculated based on operating accounts only. 29 1 Exhibit 5 Traverse Bank Benchmark Data for Small Retail Stores 2 3 4 5 Ratio 6 Return on assets 7 Return on equity 8 Net margin 9 Asset turnover 10 Days payables 11 Days receivables 12 Inventory turnover 13 Quick ratio 14 Current ratio 15 Interest coverage 16 Debt-to-assets 17 Assets-to-equity Definition Net income/Total assets Net income/Owner's equity Net income/Revenue Revenue/Total assets Accounts payable (Cost of goods sold/365) Accounts receivable/(Revenue/365) Cost of goods sold/Inventory (Cash + Accounts receivable)/(Operating current liabilities) Operating current assets/Operating current liabilities EBIT/Interest (Long-term debt + Short-term debt)/Total assets Total assets/Owner's equity 10
Step by Step Solution
There are 3 Steps involved in it

Get step-by-step solutions from verified subject matter experts