

Question: For this problem you will need to write a C program to generate a data file and write a GNUPlot script to generate the graph.
For this problem you will need to write a program to generate a data file and write a
GNUPlot script to generate the graph.
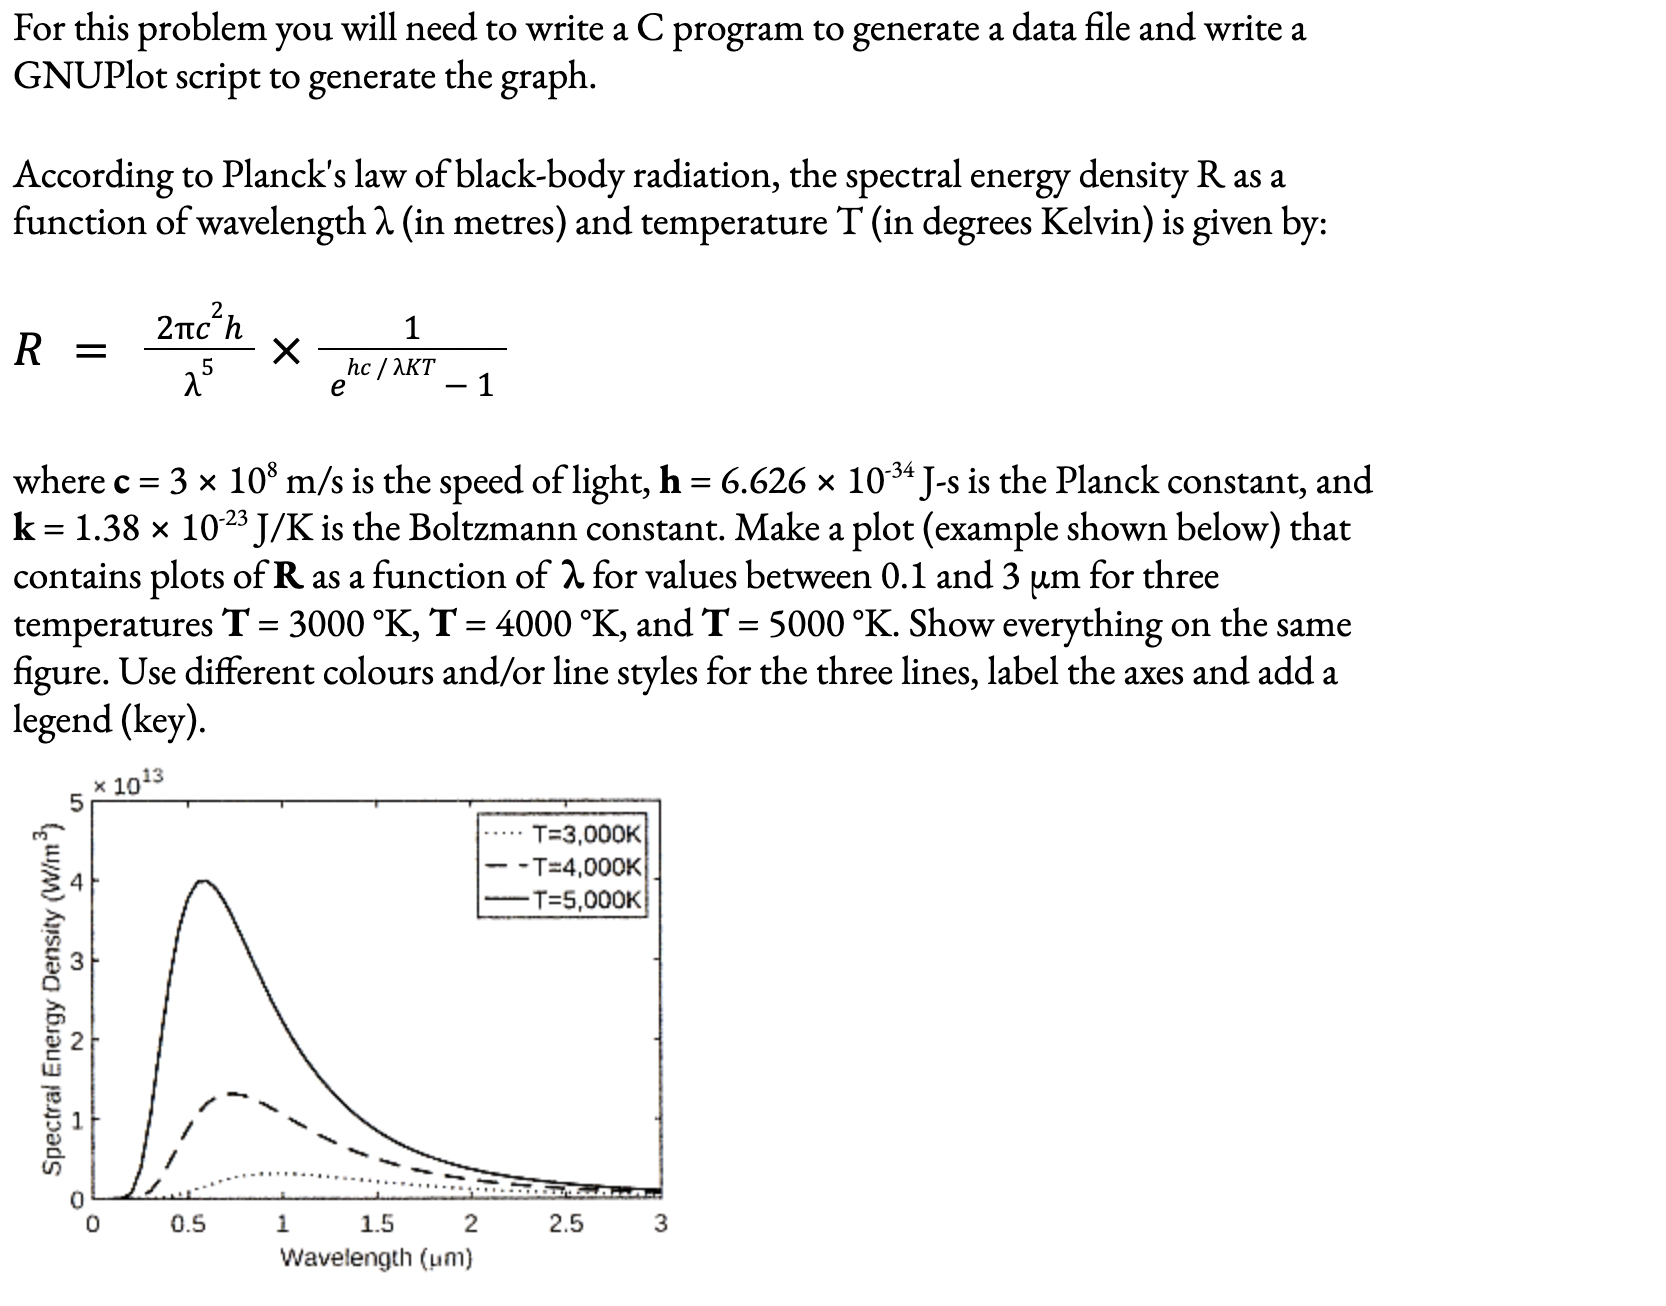
According to Planck's law of blackbody radiation, the spectral energy density as a
function of wavelength in metres and temperature in degrees Kelvin is given by:
where is the speed of light, s is the Planck constant, and
is the Boltzmann constant. Make a plot example shown below that
contains plots of as a function of for values between and for three
temperatures and Show everything on the same
figure. Use different colours andor line styles for the three lines, label the axes and add a
legend key
Step by Step Solution
There are 3 Steps involved in it
1 Expert Approved Answer
Step: 1 Unlock

Question Has Been Solved by an Expert!
Get step-by-step solutions from verified subject matter experts
Step: 2 Unlock
Step: 3 Unlock