

Question: For this problem, your job is to simulate the stock price St and volatility process Vi under the Heston model dSt = uStdt +S+V VidB,
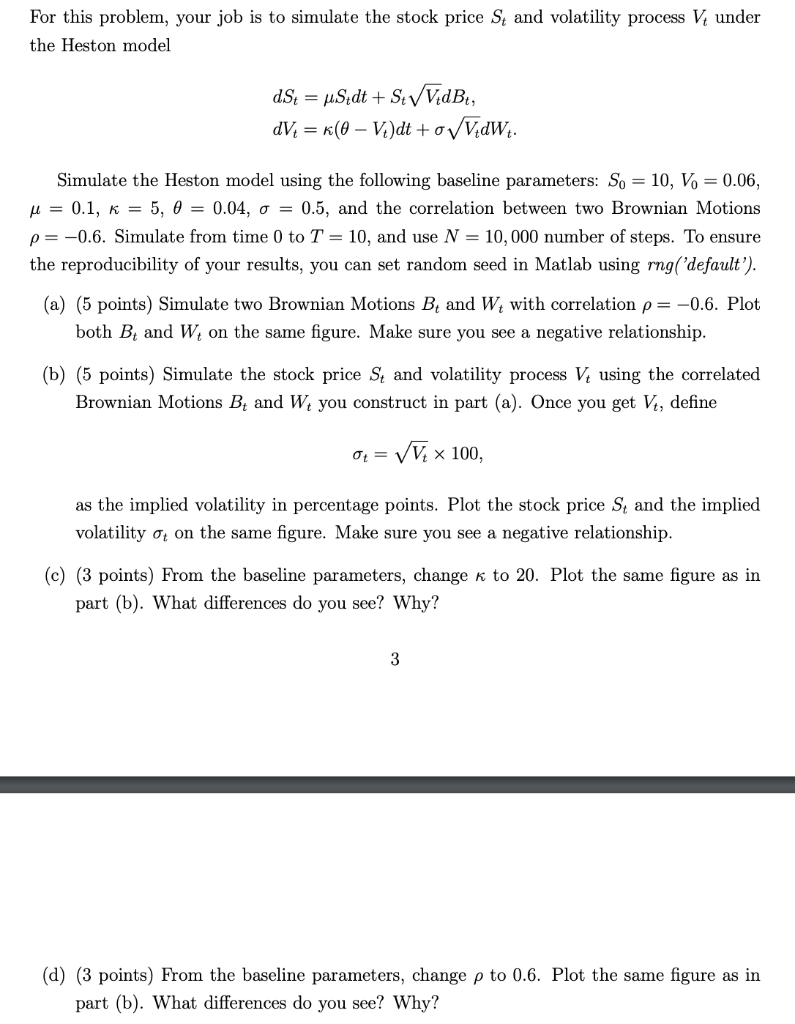
For this problem, your job is to simulate the stock price St and volatility process Vi under the Heston model dSt = uStdt +S+V VidB, dV4 = R(0 V+)dt +0V VdWt. Simulate the Heston model using the following baseline parameters: So = 10, V = 0.06, u = 0.1, k = 5, Q = 0.04, o = 0.5, and the correlation between two Brownian Motions p=-0.6. Simulate from time 0 to T = 10, and use N = 10,000 number of steps. To ensure the reproducibility of your results, you can set random seed in Matlab using rng('default'). (a) (5 points) Simulate two Brownian Motions B; and W1 with correlation p= -0.6. Plot both B; and W, on the same figure. Make sure you see a negative relationship. (b) (5 points) Simulate the stock price St and volatility process V using the correlated Brownian Motions B, and W4 you construct in part (a). Once you get V, define 0 = V x 100, as the implied volatility in percentage points. Plot the stock price St and the implied volatility 07 on the same figure. Make sure you see a negative relationship. (c) (3 points) From the baseline parameters, change k to 20. Plot the same figure as in part (b). What differences do you see? Why? (d) (3 points) From the baseline parameters, change p to 0.6. Plot the same figure as in part (b). What differences do you see? Why? For this problem, your job is to simulate the stock price St and volatility process Vi under the Heston model dSt = uStdt +S+V VidB, dV4 = R(0 V+)dt +0V VdWt. Simulate the Heston model using the following baseline parameters: So = 10, V = 0.06, u = 0.1, k = 5, Q = 0.04, o = 0.5, and the correlation between two Brownian Motions p=-0.6. Simulate from time 0 to T = 10, and use N = 10,000 number of steps. To ensure the reproducibility of your results, you can set random seed in Matlab using rng('default'). (a) (5 points) Simulate two Brownian Motions B; and W1 with correlation p= -0.6. Plot both B; and W, on the same figure. Make sure you see a negative relationship. (b) (5 points) Simulate the stock price St and volatility process V using the correlated Brownian Motions B, and W4 you construct in part (a). Once you get V, define 0 = V x 100, as the implied volatility in percentage points. Plot the stock price St and the implied volatility 07 on the same figure. Make sure you see a negative relationship. (c) (3 points) From the baseline parameters, change k to 20. Plot the same figure as in part (b). What differences do you see? Why? (d) (3 points) From the baseline parameters, change p to 0.6. Plot the same figure as in part (b). What differences do you see? Why
Step by Step Solution
There are 3 Steps involved in it

Get step-by-step solutions from verified subject matter experts