

Question: For this project, were going to use cluster analysis to tell a story about our data. In this class?? I know, its shocking. Im asking
For this project, were going to use cluster analysis to tell a story about our data. In this class?? I know, its shocking. Im asking you to divide the Oregonians in your sample into groups based on two variables.
Please note this project will likely take some trial and error. Please relax into it and have some fun with the process: think of it as an exploration. Trial and error is the spice of life!
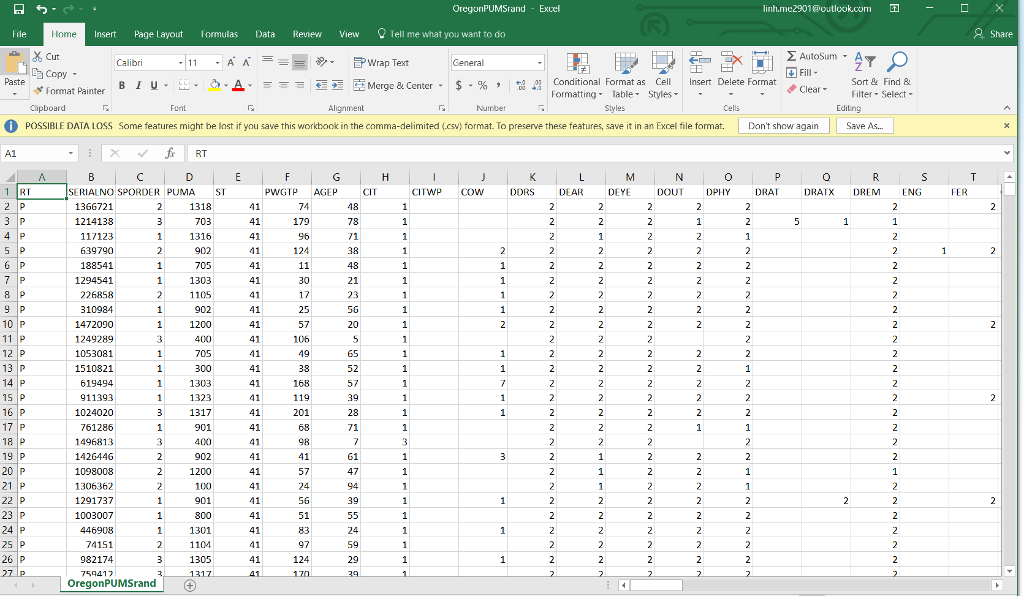
You will begin by taking a random subset of the OregonPUMSrand.csv data. Its the same data youve seen before, with an extra column to allow randomization. You will take a small subset of this data (I recommend n=400, so as not to upset Statgraphics too much).
Process:
Step 1: Pick your sample (use Excel to sort>RANDOM, then take the top 400 rows and save them, or better yet, pick a random row in the randomized Excel file on Canvas and select the next 400 people)
Step 2: Import that smaller file into Statgraphics (File>Open>Open Data Source>External Data File)
Step 3: Open the clustering dialog in Statgraphics (Describe>Multivariate Methods>Cluster Analysis)
Step 4: Choose your two variables. I recommend you choose continuous variables.
Step 5: Click OK.
Step 6: Pick your settings (I recommend starting with the default settings and 4 clusters) and click OK.
Step 7: Choose default settings plus 2D scatterplot and click OK
Step 8: Click on your scatterplot to make it bigger. Right click and choose Graphics Options and Pane Options to prettify your graph (larger points, circle clusters, labels, etc). Save that graph in a word document.
Step 9: Right click and choose Analysis Options to change your choices in Step 6.
Step 10: Keep repeating Step 9 until you like several of your graphs!
Step 11: Write up your project!
For your final report, include and explain your clustering. You may choose to use your Statgraphics output or use Tableau/Excel/other software to make a prettier graph. Tell your story, and how the clustering supports that story. Who are these groups? What does this clustering tell us about the people in Oregon? How did your thinking change as you refined your cluster analysis?
To really impress, give a little flavor! Describe a set of particular individuals who exemplify each cluster!.
Step by Step Solution
There are 3 Steps involved in it

Get step-by-step solutions from verified subject matter experts